Countries
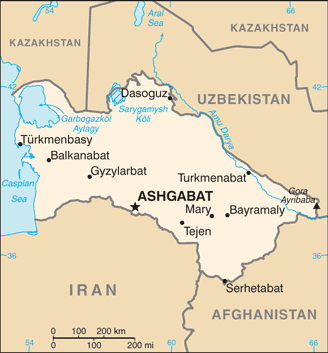
Turkmenistan

Key Economic Indicators
$158.98 billion
$21,213
6.3%
6.1% (2020 est.)
4.27%
$64.24 billion (2024 est.)
24.1% of GDP (2016 est.)
Economic Overview
<p>upper-middle-income Central Asian economy; houses fourth-largest natural gas reserves and rich in natural resources; authoritarian and dominated by state-owned enterprises; challenges include overvalued currency, high inflation risks, lack of economic diversification due to heavy state control and bureaucracy</p>
All Economic Data
Agricultural products
milk, wheat, potatoes, cotton, watermelons, tomatoes, grapes, barley, beef, lamb/mutton (2023)
note:
<b>note:</b> top ten agricultural products based on tonnage
Average household expenditures
On alcohol and tobacco:
2.2% of household expenditures (2023 est.)
On food:
36.5% of household expenditures (2023 est.)
Budget
Expenditures:
$6.134 billion (2019 est.)
Revenues:
$5.954 billion (2019 est.)
Currency
code:
TMT
name:
Turkmenistan manat (TMT) [m]
Debt - external
$3.32 billion
Debt - external 2023:
$3.696 billion (2023 est.)
Note:
<b>note:</b> present value of external debt in current US dollars
Exchange rates
Currency:
Turkmenistani manat (TMM) per US dollar -
Exchange rates 2014:
3.5 (2014 est.)
Exchange rates 2015:
3.5 (2015 est.)
Exchange rates 2016:
3.5 (2016 est.)
Exchange rates 2017:
4.125 (2017 est.)
Exports
$9.03 billion
Exports 2021:
$10.282 billion (2021 est.)
Exports 2022:
$14.67 billion (2022 est.)
Exports 2023:
$13.111 billion (2023 est.)
Note:
<strong>note: </strong>GDP expenditure basis - exports of goods and services in current dollars
Exports - commodities
natural gas, refined petroleum, fertilizers, crude petroleum, electricity (2023)
note:
<b>note:</b> top five export commodities based on value in dollars
Exports - partners
China 63%, Turkey 11%, Greece 7%, Uzbekistan 6%, Azerbaijan 4% (2023)
note:
<b>note:</b> top five export partners based on percentage share of exports
Foreign direct investment
net inflows:
$1.64 billion
GDP - composition, by sector of origin
Agriculture:
11.3% (2023 est.)
Industry:
39.3% (2023 est.)
Note:
<b>note:</b> figures may not total 100% due to non-allocated consumption not captured in sector-reported data
Services:
49.4% (2023 est.)
GDP (official exchange rate)
$64.24 billion (2024 est.)
note:
<b>note:</b> data in current dollars at official exchange rate
GDP per capita (nominal)
$6,857
Gini Index coefficient - distribution of family income
40.8 (1998)
GNI (gross national income)
$50.92 billion
GNI per capita
$6,510
Imports
$5.74 billion
Imports 2021:
$6.25 billion (2021 est.)
Imports 2022:
$7.362 billion (2022 est.)
Imports 2023:
$7.563 billion (2023 est.)
Note:
<strong>note: </strong>GDP expenditure basis - imports of goods and services in current dollars
Imports - commodities
broadcasting equipment, cars, wheat, computers, iron pipes (2023)
note:
<b>note:</b> top five import commodities based on value in dollars
Imports - partners
Turkey 21%, UAE 21%, China 20%, Kazakhstan 8%, Germany 5% (2023)
note:
<b>note:</b> top five import partners based on percentage share of imports
Industries
natural gas, oil, petroleum products, textiles, food processing
Inflation rate (consumer prices)
Inflation rate (consumer prices) 2020:
6.1% (2020 est.)
Inflation rate (consumer prices) 2021:
19.5% (2021 est.)
Inflation rate (consumer prices) 2022:
11.5% (2022 est.)
Note:
<strong>note:</strong> annual % change based on consumer prices
Labor force
2.445 million (2024 est.)
note:
<b>note:</b> number of people ages 15 or older who are employed or seeking work
total:
2.2 million persons
Labor force - by occupation
agriculture:
21.93%
industry:
28.57%
services:
49.5%
Public debt
Public debt 2016:
24.1% of GDP (2016 est.)
Real GDP (purchasing power parity)
$158.98 billion
Note:
<b>note:</b> data in 2017 dollars
Real GDP (purchasing power parity) 2022:
$123.778 billion (2022 est.)
Real GDP (purchasing power parity) 2023:
$131.576 billion (2023 est.)
Real GDP (purchasing power parity) 2024:
$134.555 billion (2024 est.)
Real GDP growth rate
6.3%
Note:
<b>note:</b> annual GDP % growth based on constant local currency
Real GDP growth rate 2022:
6.2% (2022 est.)
Real GDP growth rate 2023:
6.3% (2023 est.)
Real GDP growth rate 2024:
2.3% (2024 est.)
Real GDP per capita
$21,213
Note:
<b>note:</b> data in 2017 dollars
Real GDP per capita 2022:
$17,100 (2022 est.)
Real GDP per capita 2023:
$17,900 (2023 est.)
Real GDP per capita 2024:
$18,000 (2024 est.)
Remittances
Note:
<b>note:</b> personal transfers and compensation between resident and non-resident individuals/households/entities
Remittances 2021:
0% of GDP (2021 est.)
Remittances 2022:
0% of GDP (2022 est.)
Remittances 2023:
0% of GDP (2023 est.)
Unemployment rate
4.27%
Note:
<b>note:</b> % of labor force seeking employment
Unemployment rate 2022:
4.2% (2022 est.)
Unemployment rate 2023:
4.1% (2023 est.)
Unemployment rate 2024:
4.4% (2024 est.)
Youth unemployment rate (ages 15-24)
Female:
6% (2024 est.)
Male:
14.7% (2024 est.)
Note:
<b>note:</b> % of labor force ages 15-24 seeking employment
Total:
9.6% (2024 est.)
Economic Rankings
Inflation Rate
#32
GDP Growth Rate
#57
Gini Index
#62
GDP (Nominal)
#87
GDP (PPP)
#88
GDP per Capita
#90
External Debt
#92
Exports
#100
Unemployment Rate
#120
Imports
#135
Quick Facts
Industries
natural gas, oil, petroleum products, textiles, food processing
Agricultural products
milk, wheat, potatoes, cotton, watermelons, tomatoes, grapes, barley, beef, lamb/mutton (2023)
Labor force
2.445 million (2024 est.)
Exports - partners
China 63%, Turkey 11%, Greece 7%, Uzbekistan 6%, Azerbaijan 4% (2023)
Imports - partners
Turkey 21%, UAE 21%, China 20%, Kazakhstan 8%, Germany 5% (2023)
Exchange rates
Turkmenistani manat (TMM) per US dollar -
Explore More
Our Partners
Trusted partner applications powering global data and insights