Countries
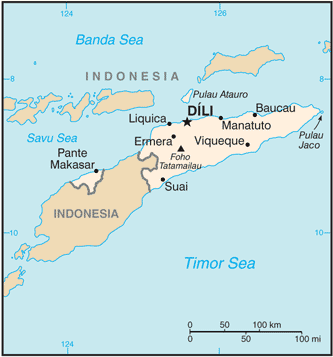
Timor-Leste

Key Economic Indicators
$6.19 billion
$4,423
-9.1%
2.06%
1.59%
$1.881 billion (2024 est.)
3.1% of GDP (2016 est.)
$-587,484,109
Economic Overview
lower middle-income Southeast Asian economy; government expenditures funded via oil fund drawdowns; endemic corruption undermines growth; foreign aid-dependent; wide-scale poverty, unemployment, and illiteracy
All Economic Data
Agricultural products
maize, rice, coconuts, root vegetables, vegetables, cassava, other meats, pork, beans, coffee (2023)
note:
<b>note:</b> top ten agricultural products based on tonnage
Budget
Expenditures:
$1.826 billion (2022 est.)
Note:
<b>note:</b> central government revenues (excluding grants) and expenditures converted to US dollars at average official exchange rate for year indicated
Revenues:
$1.877 billion (2022 est.)
Currency
code:
USD
name:
United States dollar (USD) [$]
Current account balance
$-587,484,109
Current account balance 2022:
$408.059 million (2022 est.)
Current account balance 2023:
-$177.336 million (2023 est.)
Current account balance 2024:
-$529.738 million (2024 est.)
Note:
<b>note:</b> balance of payments - net trade and primary/secondary income in current dollars
Debt - external
$296.67 million
Debt - external 2023:
$238.042 million (2023 est.)
Note:
<b>note:</b> present value of external debt in current US dollars
Exchange rates
<p>the US dollar is used</p>
Exports
$196.96 million
Exports 2022:
$1.858 billion (2022 est.)
Exports 2023:
$701.808 million (2023 est.)
Exports 2024:
$278.047 million (2024 est.)
Note:
<b>note:</b> balance of payments - exports of goods and services in current dollars
Exports - commodities
crude petroleum, natural gas, coffee, scrap iron, telephones (2023)
note:
<b>note:</b> top five export commodities based on value in dollars
Exports - partners
China 46%, Singapore 25%, Japan 15%, Indonesia 5%, USA 3% (2023)
note:
<b>note:</b> top five export partners based on percentage share of exports
Foreign direct investment
net inflows:
$215.6 million
GDP - composition, by end use
Exports of goods and services:
22.9% (2023 est.)
Government consumption:
52.9% (2023 est.)
Household consumption:
70% (2023 est.)
Imports of goods and services:
-66.4% (2023 est.)
Investment in fixed capital:
17.4% (2023 est.)
Investment in inventories:
3.1% (2023 est.)
Note:
<b>note:</b> figures may not total 100% due to rounding or gaps in data collection
GDP - composition, by sector of origin
Agriculture:
16.9% (2023 est.)
Industry:
23.9% (2023 est.)
Note:
<b>note:</b> figures may not total 100% due to non-allocated consumption not captured in sector-reported data
Services:
61% (2023 est.)
GDP (official exchange rate)
$1.881 billion (2024 est.)
note:
<b>note:</b> data in current dollars at official exchange rate
GDP per capita (nominal)
$1,332
Gini Index coefficient - distribution of family income
28.7 (2014)
GNI (gross national income)
$2.13 billion
GNI per capita
$1,650
Gross domestic investment
30 % of GDP
Imports
$1.58 billion
Imports 2022:
$1.286 billion (2022 est.)
Imports 2023:
$1.169 billion (2023 est.)
Imports 2024:
$1.197 billion (2024 est.)
Note:
<b>note:</b> balance of payments - imports of goods and services in current dollars
Imports - commodities
refined petroleum, rice, cars, plastic products, trucks (2023)
note:
<b>note:</b> top five import commodities based on value in dollars
Imports - partners
Indonesia 34%, China 26%, Singapore 9%, Taiwan 5%, India 4% (2023)
note:
<b>note:</b> top five import partners based on percentage share of imports
Industrial production growth rate
-57% (2023 est.)
note:
<b>note:</b> annual % change in industrial value added based on constant local currency
Industries
printing, soap manufacturing, handicrafts, woven cloth
Inflation rate (consumer prices)
2.06%
Inflation rate (consumer prices) 2022:
7% (2022 est.)
Inflation rate (consumer prices) 2023:
8.4% (2023 est.)
Inflation rate (consumer prices) 2024:
2.1% (2024 est.)
Note:
<b>note:</b> annual % change based on consumer prices
Labor force
615,900 (2024 est.)
note:
<b>note:</b> number of people ages 15 or older who are employed or seeking work
total:
635,489 persons
Labor force - by occupation
agriculture:
46.02%
industry:
3.8%
services:
50.18%
Public debt
Public debt 2016:
3.1% of GDP (2016 est.)
Real GDP (purchasing power parity)
$6.19 billion
Note:
<b>note:</b> data in 2021 dollars
Real GDP (purchasing power parity) 2022:
$7.322 billion (2022 est.)
Real GDP (purchasing power parity) 2023:
$5.995 billion (2023 est.)
Real GDP (purchasing power parity) 2024:
$5.863 billion (2024 est.)
Real GDP growth rate
-9.1%
Note:
<b>note:</b> annual GDP % growth based on constant local currency
Real GDP growth rate 2022:
-20.5% (2022 est.)
Real GDP growth rate 2023:
-18.1% (2023 est.)
Real GDP growth rate 2024:
-2.2% (2024 est.)
Real GDP per capita
$4,423
Note:
<b>note:</b> data in 2021 dollars
Real GDP per capita 2022:
$5,300 (2022 est.)
Real GDP per capita 2023:
$4,300 (2023 est.)
Real GDP per capita 2024:
$4,200 (2024 est.)
Remittances
$219.57 million
Note:
<b>note:</b> personal transfers and compensation between resident and non-resident individuals/households/entities
Remittances 2022:
5.1% of GDP (2022 est.)
Remittances 2023:
9.3% of GDP (2023 est.)
Remittances 2024:
11.7% of GDP (2024 est.)
Reserves of foreign exchange and gold
$736.97 million
Note:
<b>note:</b> holdings of gold (year-end prices)/foreign exchange/special drawing rights in current dollars
Reserves of foreign exchange and gold 2022:
$830.81 million (2022 est.)
Reserves of foreign exchange and gold 2023:
$781.995 million (2023 est.)
Reserves of foreign exchange and gold 2024:
$736.967 million (2024 est.)
Revenue (excl grants)
51 % of GDP
Tax revenue
22 % of GDP
Taxes and other revenues
21.6% (of GDP) (2022 est.)
note:
<b>note:</b> central government tax revenue as a % of GDP
Unemployment rate
1.59%
Note:
<b>note:</b> % of labor force seeking employment
Unemployment rate 2022:
1.6% (2022 est.)
Unemployment rate 2023:
1.6% (2023 est.)
Unemployment rate 2024:
1.7% (2024 est.)
Youth unemployment rate (ages 15-24)
Female:
3.7% (2024 est.)
Male:
3.2% (2024 est.)
Note:
<b>note:</b> % of labor force ages 15-24 seeking employment
Total:
3.4% (2024 est.)
World Bank Indicators
Currency
Trinidad and Tobago dollar (TTD) $ (2025)
Gini Index
40.30 (1992)
Languages
English (2025)
Economic Rankings
Inflation Rate
#99
External Debt
#121
Reserves
#148
GDP per Capita
#154
Gini Index
#159
Exports
#162
GDP (PPP)
#166
Unemployment Rate
#168
Imports
#168
GDP (Nominal)
#177
GDP Growth Rate
#192
Quick Facts
Industries
printing, soap manufacturing, handicrafts, woven cloth
Agricultural products
maize, rice, coconuts, root vegetables, vegetables, cassava, other meats, pork, beans, coffee (2023)
Labor force
615,900 (2024 est.)
Exports - partners
China 46%, Singapore 25%, Japan 15%, Indonesia 5%, USA 3% (2023)
Imports - partners
Indonesia 34%, China 26%, Singapore 9%, Taiwan 5%, India 4% (2023)
Exchange rates
<p>the US dollar is used</p>
Explore More
Our Partners
Trusted partner applications powering global data and insights