Countries
Nauru

Key Economic Indicators
$169.32 million
$14,173
1.39%
1.8% (2020 est.)
$160.351 million (2024 est.)
65% of GDP (2016 est.)
$9.73 million
Economic Overview
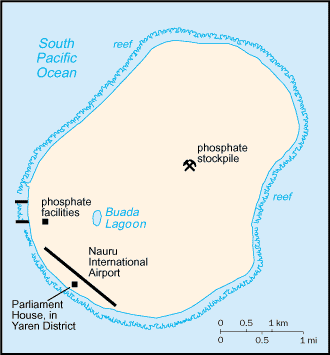
upper-middle-income Pacific island country; phosphate resource exhaustion made island interior uninhabitable; licenses fishing rights; houses Australia’s Regional Processing Centre; former tax haven; largely dependent on foreign subsidies
All Economic Data
Agricultural products
coconuts, tropical fruits, pork, eggs, pork offal, pork fat, chicken, papayas, vegetables, cabbages (2023)
note:
<b>note:</b> top ten agricultural products based on tonnage
Budget
Expenditures:
$157.86 million (2020 est.)
Note:
<b>note:</b> central government revenues (excluding grants) and expenditures converted to US dollars at average official exchange rate for year indicated
Revenues:
$199.74 million (2020 est.)
Currency
code:
AUD
name:
Australian dollar (AUD) [$]
Current account balance
$9.73 million
Current account balance 2021:
$6.597 million (2021 est.)
Current account balance 2022:
$2.966 million (2022 est.)
Current account balance 2023:
$1.923 million (2023 est.)
Note:
<b>note:</b> balance of payments - net trade and primary/secondary income in current dollars
Exchange rates
Currency:
Australian dollars (AUD) per US dollar -
Exchange rates 2020:
1.453 (2020 est.)
Exchange rates 2021:
1.331 (2021 est.)
Exchange rates 2022:
1.442 (2022 est.)
Exchange rates 2023:
1.505 (2023 est.)
Exchange rates 2024:
1.515 (2024 est.)
Exports
$89.95 million
Exports 2021:
$54.403 million (2021 est.)
Exports 2022:
$78.383 million (2022 est.)
Exports 2023:
$64.931 million (2023 est.)
Note:
<b>note:</b> balance of payments - exports of goods and services in current dollars
Exports - commodities
fish, phosphates (2023)
note:
<strong>note:</strong> top export commodities based on value in dollars over $500,000
Exports - partners
Thailand 78%, Philippines 11%, NZ 5%, Japan 1%, Canada 1% (2023)
note:
<b>note:</b> top five export partners based on percentage share of exports
Foreign direct investment
net inflows:
$-5,846,143
GDP (official exchange rate)
$160.351 million (2024 est.)
note:
<b>note:</b> data in current dollars at official exchange rate
GDP per capita (nominal)
$13,609
Gini Index coefficient - distribution of family income
34.8 (2012)
GNI (gross national income)
$252.08 million
GNI per capita
$20,400
Imports
$179.7 million
Imports 2021:
$141.185 million (2021 est.)
Imports 2022:
$165.371 million (2022 est.)
Imports 2023:
$150.193 million (2023 est.)
Note:
<b>note:</b> balance of payments - imports of goods and services in current dollars
Imports - commodities
ships, titanium ore, refined petroleum, plastic products, other foods (2023)
note:
<b>note:</b> top five import commodities based on value in dollars
Imports - partners
Australia 50%, Japan 11%, Fiji 9%, Senegal 9%, China 9% (2023)
note:
<b>note:</b> top five import partners based on percentage share of imports
Industries
phosphate mining, offshore banking, coconut products
Inflation rate (consumer prices)
Inflation rate (consumer prices) 2020:
1.8% (2020 est.)
Inflation rate (consumer prices) 2021:
2.4% (2021 est.)
Inflation rate (consumer prices) 2022:
2.6% (2022 est.)
Note:
<strong>note:</strong> annual % change based on consumer prices
Public debt
Public debt 2016:
65% of GDP (2016 est.)
Real GDP (purchasing power parity)
$169.32 million
Note:
<b>note:</b> data in 2021 dollars
Real GDP (purchasing power parity) 2022:
$147.026 million (2022 est.)
Real GDP (purchasing power parity) 2023:
$147.976 million (2023 est.)
Real GDP (purchasing power parity) 2024:
$150.581 million (2024 est.)
Real GDP growth rate
1.39%
Note:
<b>note:</b> annual GDP % growth based on constant local currency
Real GDP growth rate 2022:
3% (2022 est.)
Real GDP growth rate 2023:
0.6% (2023 est.)
Real GDP growth rate 2024:
1.8% (2024 est.)
Real GDP per capita
$14,173
Note:
<b>note:</b> data in 2021 dollars
Real GDP per capita 2022:
$12,500 (2022 est.)
Real GDP per capita 2023:
$12,500 (2023 est.)
Real GDP per capita 2024:
$12,600 (2024 est.)
Remittances
$2.24 million
Note:
<b>note:</b> personal transfers and compensation between resident and non-resident individuals/households/entities
Remittances 2021:
0.7% of GDP (2021 est.)
Remittances 2022:
0.6% of GDP (2022 est.)
Remittances 2023:
0.6% of GDP (2023 est.)
Taxes and other revenues
44.4% (of GDP) (2020 est.)
note:
<b>note:</b> central government tax revenue as a % of GDP
World Bank Indicators
Currency
Australian dollar (AUD) $ (2025)
Gini Index
34.80 (2012)
Languages
English, Nauru (2025)
Economic Rankings
Gini Index
#114
GDP per Capita
#116
GDP Growth Rate
#151
Inflation Rate
#189
Imports
#190
Exports
#190
GDP (Nominal)
#194
GDP (PPP)
#194
Quick Facts
Industries
phosphate mining, offshore banking, coconut products
Agricultural products
coconuts, tropical fruits, pork, eggs, pork offal, pork fat, chicken, papayas, vegetables, cabbages (2023)
Exports - partners
Thailand 78%, Philippines 11%, NZ 5%, Japan 1%, Canada 1% (2023)
Imports - partners
Australia 50%, Japan 11%, Fiji 9%, Senegal 9%, China 9% (2023)
Exchange rates
Australian dollars (AUD) per US dollar -
Explore More
Our Partners
Trusted partner applications powering global data and insights