2025 Edition Primary
Edition Builder
Introduction
Background
Kiribati is made up of three distinct island groups -- the Gilbert Islands, the Line Islands, and the Phoenix Islands. The first Austronesian voyagers arrived in the Gilbert Islands as early as 3000 B.C., but these islands were not widely settled until about A.D. 200 by Micronesians. Around 1300, Samoans and Tongans invaded the southern Gilbert Islands, then known as Tungaru, bringing Polynesian cultural elements with them. Later arrivals of Fijians brought Melanesian elements to the Gilbert Islands, and extensive intermarriage between the Micronesian, Polynesian, and Melanesian people led to the creation of what would become Gilbertese cultural traditions by the time Europeans spotted the islands in the 1600s. The Phoenix Islands and Line Islands were both visited by various Melanesian and Polynesian peoples, but their isolation and lack of natural resources meant that long-term settlements were not possible. Both island groups were uninhabited by the time of European contact.<br> <br>Kiribati experienced sustained European contact by the 1760s; all three island groups were named and charted by 1826. American whaling ships frequently passed through the islands, and the UK declared a protectorate over the Gilbert and nearby Ellice Islands in 1892, in an attempt to block growing US influence. Phosphate-rich Banaba Island was annexed to the protectorate in 1900. In 1916, the protectorate became a colony, and some Line Islands were added in 1916 and 1919, with the final ones added in 1972. The Phoenix Islands were added to the colony in 1937, and the UK agreed to share jurisdiction of some with the US because of their strategic location for aviation. During World War II, the islands were occupied by Japanese forces but were ejected by US amphibious assaults. The Ellice Islands became its own colony in 1974 and was renamed Tuvalu for “eight standing together” in 1975. The Gilbert Islands became fully self-governing in 1977 and independent in 1979 under the new name of Kiribati, the Gilbertese spelling of Gilberts. The US relinquished all claims to the sparsely inhabited Phoenix and Line Islands in a 1979 treaty of friendship.<br><br>In 2012, Kiribati purchased a 22 sq km (8.5 sq mi) plot of land in Fiji for potential eventual resettlement of its population because of climate change, and in 2014 Fijian Prime Minister Voreqe BAINIMARAMA said residents of Kiribati would be welcome to relocate to Fiji if their country is swamped by rising sea levels.
Geography
Area
- Land
- 811 sq km
- Note
- <strong>note:</strong> includes three island groups -- Gilbert Islands, Line Islands, and Phoenix Islands -- dispersed over about 3.5 million sq km (1.35 million sq mi)
- Total
- 811 sq km
- Water
- 0 sq km
Area - comparative
four times the size of Washington, D.C.
Climate
tropical; marine, hot and humid, moderated by trade winds
Coastline
1,143 km
Continent
Oceania
Elevation
- Highest point
- unnamed elevation on Banaba 81 m
- Lowest point
- Pacific Ocean 0 m
- Mean elevation
- 2 m
Geographic coordinates
1 25 N, 173 00 E
Geography - note
21 of the 33 islands are inhabited; Banaba (Ocean Island) in Kiribati is one of the three great phosphate rock islands in the Pacific Ocean -- the others are Makatea in French Polynesia, and Nauru; Kiribati is the only country in the world to fall into all four hemispheres (northern, southern, eastern, and western)
Irrigated land
0 sq km (2022)
Land boundaries
- Total
- 0 km
Land use
- Agricultural land
- 42% (2023 est.)
- Agricultural land: arable land
- arable land: 2.5% (2023 est.)
- Agricultural land: permanent crops
- permanent crops: 39.5% (2023 est.)
- Agricultural land: permanent pasture
- permanent pasture: 0% (2022 est.)
- arable land
- 2.47%
- Forest
- 1.3% (2023 est.)
- Other
- 56.7% (2023 est.)
- permanent crops
- 39.51%
Landlocked
No
Location
Oceania, group of 32 coral atolls and one raised coral island in the Pacific Ocean, straddling the Equator; the capital Tarawa is about halfway between Hawaii and Australia
Map links
- Google Maps
- https://goo.gl/maps/NBfYvrndW4skAimw9
- OpenStreetMap
- https://www.openstreetmap.org/relation/571178
Map references
Oceania
Maritime claims
- Exclusive economic zone
- 200 nm
- Territorial sea
- 12 nm
Natural hazards
typhoons can occur any time, but usually November to March; occasional tornadoes; low level of some of the islands make them sensitive to changes in sea level
Natural resources
phosphate (production discontinued in 1979), coconuts (copra), fish
Population distribution
consists of three archipelagos spread out over an area roughly the size of India; the eastern Line Islands and central Phoenix Islands are sparsely populated, but the western Gilbert Islands are some of the most densely settled places on earth, with the main island of South Tarawa boasting a population density similar to Tokyo or Hong Kong
Subregion
Micronesia
Terrain
mostly low-lying coral atolls surrounded by extensive reefs
Time zone
- UTC+12:00, UTC+13:00, UTC+14:00
- number of time zones
- 3
People and Society
Age structure
- 0-14 years
- 26.8% (male 15,895/female 15,304)
- 15-64 years
- 67.9% (male 38,046/female 41,059)
- 65 years and over
- 5.4% (2024 est.) (male 2,423/female 3,818)
Alcohol consumption per capita
- Beer
- 0.26 liters of pure alcohol (2019 est.)
- Other alcohols
- 0 liters of pure alcohol (2019 est.)
- Spirits
- 0.17 liters of pure alcohol (2019 est.)
- Total
- 0.43 liters of pure alcohol (2019 est.)
- Wine
- 0 liters of pure alcohol (2019 est.)
Birth rate
19.4 births/1,000 population (2025 est.)
Child marriage
- Men married by age 18
- 8.6% (2019)
- Women married by age 15
- 2.4% (2019)
- Women married by age 18
- 18.4% (2019)
Children under the age of 5 years underweight
6.9% (2018 est.)
Currently married women (ages 15-49)
67.4% (2020 est.)
Death rate
- 6.88 deaths/1,000 population (2025 est.)
- adult female
- 172 per 1,000
- adult male
- 222 per 1,000
Dependency ratios
- Elderly dependency ratio
- 7.9 (2024 est.)
- Potential support ratio
- 12.7 (2024 est.)
- Total dependency ratio
- 47.3 (2024 est.)
- Youth dependency ratio
- 39.4 (2024 est.)
Drinking water source
- improved total
- 15.09%
- Improved: rural
- rural: 59.5% of population (2022 est.)
- Improved: total
- total: 75.7% of population (2022 est.)
- Improved: urban
- urban: 87.9% of population (2022 est.)
- Unimproved: rural
- rural: 40.5% of population (2022 est.)
- Unimproved: total
- total: 24.3% of population (2022 est.)
- Unimproved: urban
- urban: 12.1% of population (2022 est.)
Education expenditure
- Education expenditure (% GDP)
- 16.4% of GDP (2023 est.)
- Education expenditure (% national budget)
- 20.1% national budget (2024 est.)
Education expenditures
16 % of GDP
Ethnic groups
I-Kiribati 95.78%, I-Kiribati/mixed 3.8%, Tuvaluan 0.2%, other 1.7% (2020 est.)
Gross reproduction rate
1.04 (2025 est.)
Health expenditure
- 11 % of GDP
- Health expenditure (as % of GDP)
- 14.8% of GDP (2021)
- Health expenditure (as % of national budget)
- 9.7% of national budget (2022 est.)
Hospital bed density
1.9 beds/1,000 population (2016 est.)
Infant mortality rate
- Female
- 29.4 deaths/1,000 live births
- Male
- 33.5 deaths/1,000 live births
- neonatal
- 22 deaths/1,000 live births
- Total
- 30.8 deaths/1,000 live births (2025 est.)
Languages
- Gilbertese, English (official)
- languages
- English, Gilbertese
- number of languages
- 2
Life expectancy at birth
- Female
- 71.3 years
- Male
- 65.9 years
- Total population
- 68.5 years (2024 est.)
Literacy
- Female
- 98.9% (2020 est.)
- Male
- 98.6% (2020 est.)
- Total population
- 98.6% (2020 est.)
Major urban areas - population
64,000 TARAWA (capital) (2018)
Maternal mortality ratio
80 deaths/100,000 live births (2023 est.)
Median age
- Female
- 28.2 years
- Male
- 26.4 years
- Total
- 27.7 years (2025 est.)
Mother's mean age at first birth
- 23.1 years (2009 est.)
- note
- <strong>note:</strong> data represents median age at first birth among women 25-29
Nationality
- Adjective
- Kiribati
- Noun
- I-Kiribati (singular and plural)
Net migration rate
-2.75 migrant(s)/1,000 population (2025 est.)
Obesity - adult prevalence rate
46% (2016)
Physician density
0.2 physicians/1,000 population (2013)
Population
- Female
- 60,181
- Male
- 56,364
- Total
- 116,545 (2024 est.)
Population growth rate
0.98% (2025 est.)
Religions
Roman Catholic 58.9%, Kiribati Uniting Church 21.2%, Kiribati Protestant Church 8.4%, Church of Jesus Christ 5.6%, Seventh Day Adventist 2.1%, Baha'i 2.1%, other 1.7% (2020 est.)
Sanitation facility access
- improved total
- 24.65%
- Improved: rural
- rural: 48.1% of population (2022 est.)
- Improved: total
- total: 62.1% of population (2022 est.)
- Improved: urban
- urban: 72.6% of population (2022 est.)
- Unimproved: rural
- rural: 51.9% of population (2022 est.)
- Unimproved: total
- total: 37.9% of population (2022 est.)
- Unimproved: urban
- urban: 27.4% of population (2022 est.)
Sex ratio
- 0-14 years
- 1.04 male(s)/female
- 15-64 years
- 0.93 male(s)/female
- 65 years and over
- 0.63 male(s)/female
- At birth
- 1.05 male(s)/female
- Total population
- 0.94 male(s)/female (2024 est.)
Tobacco use
- Female
- 23.6% (2025 est.)
- Male
- 48.4% (2025 est.)
- Total
- 35.4% (2025 est.)
Total fertility rate
2.13 children born/woman (2025 est.)
Urbanization
- Rate of urbanization
- 2.77% annual rate of change (2020-25 est.)
- Urban population
- 57.8% of total population (2023)
Vaccination rate
- measles
- 79%
Government
Administrative divisions
3 geographical units: Gilbert Islands, Line Islands, Phoenix Islands; there are no first-order administrative divisions, but the 6 districts are Banaba, Central Gilberts, Line Islands, Northern Gilberts, Southern Gilberts, Tarawa, with 21 island councils on Abaiang, Abemama, Aranuka, Arorae, Banaba, Beru, Butaritari, Kanton, Kiritimati, Kuria, Maiana, Makin, Marakei, Nikunau, Nonouti, Onotoa, Tabiteuea, Tabuaeran, Tamana, Tarawa, Teraina
Capital
- Etymology
- the name is said to derive from the I-Kiribati words <em>te </em>(the) and <em>rawa </em>(run), referring to a channel through a nearby reef
- Geographic coordinates
- 1 21 N, 173 02 E
- Name
- Tarawa
- Time difference
- UTC+12 (17 hours ahead of Washington, DC, during Standard Time)
- Time zone note
- Kiribati has three time zones: the Gilbert Islands group at UTC+12, the Phoenix Islands at UTC+13, and the Line Islands at UTC+14
Citizenship
- Citizenship by birth
- no
- Citizenship by descent only
- at least one parent must be a native-born citizen of Kiribati
- Dual citizenship recognized
- no
- Residency requirement for naturalization
- 7 years
Coat of arms
- svg
- https://mainfacts.com/media/images/coats_of_arms/ki.svg
Constitution
- Amendment process
- proposed by the House of Assembly; passage requires two-thirds majority vote by the Assembly membership; passage of amendments affecting the constitutional section on amendment procedures and parts of the constitutional chapter on citizenship requires deferral of the proposal to the next Assembly meeting where approval is required by at least two-thirds majority vote of the Assembly membership and support of the nominated or elected Banaban member of the Assembly; amendments affecting the protection of fundamental rights and freedoms also requires approval by at least two-thirds majority in a referendum
- History
- The Gilbert and Ellice Islands Order in Council 1915, The Gilbert Islands Order in Council 1975 (pre-independence); latest promulgated 12 July 1979 (at independence)
Country name
- alternative spellings
- KI, Republic of Kiribati, Ribaberiki Kiribati
- Conventional long form
- Republic of Kiribati
- Conventional short form
- Kiribati
- Etymology
- the name is the local pronunciation of "Gilbert," the former designation of the islands; originally named after explorer Thomas GILBERT, who mapped many of the islands in 1788
- Former
- Gilbert Islands
- Local long form
- Republic of Kiribati
- local long form (eng)
- Independent and Sovereign Republic of Kiribati
- Local short form
- Kiribati
- Note
- <strong>note:</strong> pronounced keer-ree-bahss
Diplomatic representation from the US
- Chief of mission
- Ambassador Marie DAMOUR (since 6 December 2022); note - Ambassador DAMOUR is based in the US Embassy in the Republic of Fiji and is accredited to Kiribati as well as Nauru, Tonga, and Tuvalu
- Note
- <strong>Note</strong>: the US does not have an embassy in Kiribati but has announced its intention to open an embassy
Diplomatic representation in the US
- Chancery
- 685 Third Avenue, Suite 1109, New York, NY 10017
- Chief of mission
- Ambassador Teburoro TITO (since 24 January 2018); note - also Permanent Representative to the UN
- Email address and website
- <br>Kimission.newyork@mfa.gov.ki
- FAX
- [1] (212) 867-3320
- Telephone
- [1] (212) 867-3310
Executive branch
- Cabinet
- Cabinet appointed by the president from among House of Assembly members
- Chief of state
- President Taneti MAAMAU (since 11 March 2016)
- Election results
- <em>2024: </em>Taneti MAAMAU reelected president; percent of vote - Taneti MAAMAU (TKP) 55%, Kaotitaake KOKORIA (independent) 42%, Bautaake BEIA (TKP) 3%<br><em><br>2020:</em> Taneti MAAMAU reelected president; percent of vote - Taneti MAAMAU (TKP) 59.3%, Banuera BERINA (BKM) 40.7%
- Election/appointment process
- president directly elected for a 4-year term (eligible for 2 additional terms) by simple-majority popular vote, after candidates are nominated from among House of Assembly members; vice president appointed by the president
- Expected date of next election
- 2028
- Head of government
- President Taneti MAAMAU (since 11 March 2016)
- Most recent election date
- 25 October 2024
- Note
- <strong>note:</strong> the president is both chief of state and head of government
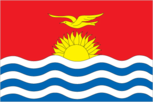
Flag
<strong>description:</strong> the upper half is red with a yellow frigatebird flying over a yellow rising sun, and the lower half is blue with three wavy horizontal white stripes to represent the Pacific Ocean<br><br><strong>meaning:</strong> the white stripes represent the Gilbert, Line, and Phoenix island groups; the 17 rays of the sun represent the 16 Gilbert Islands and Banaba (formerly Ocean Island); the frigatebird symbolizes authority and freedom
Flag description
The flag of Kiribati is divided into two halves. While the upper half has a red field, at the center of which is a yellow frigate bird flying over the top half of a rising yellow sun with seventeen visible rays, the lower half is composed of six horizontal wavy bands of white alternating with blue to depict the ocean.
Flag image
- svg
- https://flagcdn.com/ki.svg
Government type
presidential republic
Independence
12 July 1979 (from the UK)
International law organization participation
has not submitted an ICJ jurisdiction declaration; non-party state to the ICCt
International organization participation
ABEDA, ACP, ADB, AOSIS, C, FAO, IBRD, ICAO, ICRM, IDA, IFAD, IFC, IFRCS, ILO, IMF, IMO, IOC, ITU, ITUC (NGOs), OPCW, PIF, Sparteca, SPC, UN, UNCTAD, UNDP, UNESCO, UPU, WHO, WIPO, WMO
Judicial branch
- Highest court(s)
- High Court (consists of a chief justice and other judges as prescribed by the president)
- Judge selection and term of office
- chief justice appointed by the president on the advice of the cabinet in consultation with the Public Service Commission (PSC); other judges appointed by the president on the advice of the chief justice along with the PSC
- Subordinate courts
- Court of Appeal; magistrates' courts
Legal system
English common law supplemented by customary law
Legislative branch
- Electoral system
- plurality/majority
- Expected date of next election
- August 2028
- Legislative structure
- unicameral
- Legislature name
- House of Assembly (Maneaba Ni Maungatabu)
- Most recent election date
- 8/14/2024 to 8/19/2024
- Number of seats
- 45 (44 directly elected; 1 appointed)
- Percentage of women in chamber
- 11.1%
- Scope of elections
- full renewal
- Term in office
- 4 years
National color(s)
red, white, blue, yellow
National heritage
- Selected World Heritage Site locales
- Phoenix Islands Protected Area
- Total World Heritage Sites
- 1 (natural)
National holiday
Independence Day, 12 July (1979)
National symbol(s)
frigatebird
Political parties
Boutokaan Kiribati Moa Party or BKM <br>Kiribati Moa Party or KMP<br>Kamanoan Kiribati Party or KKP<br>Tobwaan Kiribati Party or TKP
Start of week
Monday
Suffrage
18 years of age; universal
UN Member
Yes
Economy
Agricultural products
- coconuts, bananas, vegetables, taro, tropical fruits, pork, chicken, nuts, eggs, pork offal (2023)
- note
- <b>note:</b> top ten agricultural products based on tonnage
Budget
- Expenditures
- $264.736 million (2023 est.)
- Note
- <b>note:</b> central government revenues (excluding grants) and expenditures converted to US dollars at average official exchange rate for year indicated
- Revenues
- $260.557 million (2023 est.)
Currency
- code
- AUD, KID
- name
- Australian dollar (AUD) [$], Kiribati dollar (KID) [$]
Current account balance
- $-59,540,598
- Current account balance 2021
- $20.251 million (2021 est.)
- Current account balance 2022
- -$32.523 million (2022 est.)
- Current account balance 2023
- -$5.117 million (2023 est.)
- Note
- <b>note:</b> balance of payments - net trade and primary/secondary income in current dollars
Economic overview
lower-middle income, Pacific island economy; environmentally fragile; sizable remittances; key phosphate mining fund; tourism and fishing industries; public sector-dominated economy; recent withdrawal from Pacific Islands Forum; ongoing constitutional crisis
Exchange rates
- Currency
- Australian dollars (AUD) per US dollar -
- Exchange rates 2020
- 1.453 (2020 est.)
- Exchange rates 2021
- 1.331 (2021 est.)
- Exchange rates 2022
- 1.442 (2022 est.)
- Exchange rates 2023
- 1.505 (2023 est.)
- Exchange rates 2024
- 1.515 (2024 est.)
- Note
- <strong>note:</strong> the Australian dollar circulates as legal tender
Exports
- $17.09 million
- Exports 2021
- $10.754 million (2021 est.)
- Exports 2022
- $20.58 million (2022 est.)
- Exports 2023
- $17.099 million (2023 est.)
- Note
- <b>note:</b> balance of payments - exports of goods and services in current dollars
Exports - commodities
- fish, coconut oil (2023)
- note
- <strong>note:</strong> top export commodities based on value in dollars over $500,000
Exports - partners
- Thailand 85%, Japan 6%, Philippines 3%, UAE 2%, Fiji 1% (2023)
- note
- <b>note:</b> top five export partners based on percentage share of exports
Foreign direct investment
- net inflows
- $8.07 million
GDP - composition, by end use
- Exports of goods and services
- 7.6% (2022 est.)
- Government consumption
- 61.7% (2022 est.)
- Household consumption
- 101.2% (2022 est.)
- Imports of goods and services
- -100.5% (2022 est.)
- Investment in fixed capital
- 19.1% (2022 est.)
- Investment in inventories
- 1.3% (2022 est.)
- Note
- <strong>note:</strong> figures may not total 100% due to rounding or gaps in data collection
GDP - composition, by sector of origin
- Agriculture
- 27.8% (2022 est.)
- Industry
- 9.9% (2022 est.)
- Services
- 65.7% (2022 est.)
GDP (official exchange rate)
- $307.863 million (2024 est.)
- note
- <b>note:</b> data in current dollars at official exchange rate
GDP per capita (nominal)
$2,289
Gini Index coefficient - distribution of family income
- 37 (2006)
- Gini Index coefficient - distribution of family income 2019
- 27.8 (2019 est.)
- Note
- <b>note:</b> index (0-100) of income distribution; higher values represent greater inequality
GNI (gross national income)
$503.86 million
GNI per capita
$3,660
Gross domestic investment
26 % of GDP
Household income or consumption by percentage share
- Highest 10%
- 22.8% (2019 est.)
- Lowest 10%
- 4% (2019 est.)
- Note
- <b>note:</b> % share of income accruing to lowest and highest 10% of population
Imports
- $293.47 million
- Imports 2021
- $201.984 million (2021 est.)
- Imports 2022
- $272.004 million (2022 est.)
- Imports 2023
- $293.624 million (2023 est.)
- Note
- <b>note:</b> balance of payments - imports of goods and services in current dollars
Imports - commodities
- ships, centrifuges, refined petroleum, rice, raw sugar (2023)
- note
- <b>note:</b> top five import commodities based on value in dollars
Imports - partners
- China 24%, Australia 20%, Fiji 15%, Japan 7%, NZ 6% (2023)
- note
- <b>note:</b> top five import partners based on percentage share of imports
Industrial production growth rate
- -6.2% (2022 est.)
- note
- <b>note:</b> annual % change in industrial value added based on constant local currency
Industries
fishing, handicrafts
Inflation rate (consumer prices)
- 2.46%
- Inflation rate (consumer prices) 2021
- 2.1% (2021 est.)
- Inflation rate (consumer prices) 2022
- 5.3% (2022 est.)
- Inflation rate (consumer prices) 2023
- 9.3% (2023 est.)
- Note
- <b>note:</b> annual % change based on consumer prices
Population below poverty line
- 21.9% (2019 est.)
- note
- <strong>note:</strong> % of population with income below national poverty line
Public debt
- Public debt 2016
- 22.9% of GDP (2016 est.)
Real GDP (purchasing power parity)
- $498.03 million
- Note
- <b>note:</b> data in 2021 dollars
- Real GDP (purchasing power parity) 2022
- $405.468 million (2022 est.)
- Real GDP (purchasing power parity) 2023
- $416.221 million (2023 est.)
- Real GDP (purchasing power parity) 2024
- $438.143 million (2024 est.)
Real GDP growth rate
- 5.27%
- Note
- <b>note:</b> annual GDP % growth based on constant local currency
- Real GDP growth rate 2022
- 4.6% (2022 est.)
- Real GDP growth rate 2023
- 2.7% (2023 est.)
- Real GDP growth rate 2024
- 5.3% (2024 est.)
Real GDP per capita
- $3,702
- Note
- <b>note:</b> data in 2021 dollars
- Real GDP per capita 2022
- $3,100 (2022 est.)
- Real GDP per capita 2023
- $3,100 (2023 est.)
- Real GDP per capita 2024
- $3,300 (2024 est.)
Remittances
- $14.66 million
- Note
- <b>note:</b> personal transfers and compensation between resident and non-resident individuals/households/entities
- Remittances 2021
- 4.7% of GDP (2021 est.)
- Remittances 2022
- 10.4% of GDP (2022 est.)
- Remittances 2023
- 4% of GDP (2023 est.)
Revenue (excl grants)
81 % of GDP
Tax revenue
18 % of GDP
Taxes and other revenues
- 17.7% (of GDP) (2023 est.)
- note
- <b>note:</b> central government tax revenue as a % of GDP
Energy
Electricity
- Consumption
- 27.388 million kWh (2023 est.)
- Installed generating capacity
- 12,000 kW (2023 est.)
- Transmission/distribution losses
- 5 million kWh (2023 est.)
Electricity access
- Electrification - rural areas
- 94.3% (2020 est.)
- Electrification - total population
- 94.4% (2022 est.)
- Electrification - urban areas
- 86%
Electricity generation sources
- Fossil fuels
- 81.5% of total installed capacity (2023 est.)
- hydroelectric
- 0%
- nuclear
- 0%
- renewable
- 16.37%
- Solar
- 18.5% of total installed capacity (2023 est.)
Energy consumption per capita
- Total energy consumption per capita 2023
- 8.578 million Btu/person (2023 est.)
Petroleum
- Refined petroleum consumption
- 500 bbl/day (2023 est.)
Renewable energy consumption
41.9%
Communications
Broadband - fixed subscriptions
- per 100 inhabitants
- 0 per 100
- Subscriptions per 100 inhabitants
- (2023 est.) less than 1
- Total
- 0 (2023 est.)
Broadcast media
multi-channel TV packages provide access to Australian and US stations; 1 government-operated radio station broadcasts on AM, FM, and shortwave (2017)
Internet country code
.ki
Internet users
- Percent of population
- 88% (2023 est.)
Telephone calling code
+686
Telephones - fixed lines
- Subscriptions per 100 inhabitants
- (2023 est.) less than 1
- Total subscriptions
- 0 (2023 est.)
Telephones - mobile cellular
- subscriptions per 100
- 51 per 100
- Subscriptions per 100 inhabitants
- 49 (2022 est.)
- Total subscriptions
- 70,000 (2023 est.)
Transportation
Air transport
- passengers carried
- 58,879 passengers
- registered carrier departures
- 4,427 departures
Airports
21 (2025)
Civil aircraft registration country code prefix
T3
Driving side
Left
Merchant marine
- By type
- bulk carrier 2, general cargo 24, oil tanker 11, other 37
- Total
- 74 (2023)
Ports
- Key ports
- Canton Island, English Harbor, Tarawa Atoll
- Large
- 0
- Medium
- 0
- Ports with oil terminals
- 0
- Small
- 0
- Total ports
- 3 (2024)
- Very small
- 3
Vehicle registration code
KIR
Military and Security
Military - note
Australia, NZ, and the US have provided security assistance; Kiribati has a "ship rider" agreement with the US, which allows local maritime law enforcement officers to embark on US Coast Guard (USCG) and US Navy (USN) vessels, including to board and search vessels suspected of violating laws or regulations within Kiribati's designated exclusive economic zone (EEZ) or on the high seas; ship rider agreements also enable USCG personnel and USN vessels with embarked USCG law enforcement personnel to work with host nations to protect critical regional resources (2025)
Military and security forces
Kiribati Police Service (includes Maritime Police) (2025)
Environment
Carbon dioxide emissions
- From petroleum and other liquids
- 81,000 metric tonnes of CO2 (2023 est.)
- Total emissions
- 81,000 metric tonnes of CO2 (2023 est.)
Environmental issues
heavy pollution in lagoon of south Tarawa atoll due to overcrowding mixed with traditional practices such as lagoon latrines and open-pit dumping; coastal erosion
International environmental agreements
- Party to
- Biodiversity, Climate Change, Climate Change-Kyoto Protocol, Climate Change-Paris Agreement, Comprehensive Nuclear Test Ban, Desertification, Hazardous Wastes, Law of the Sea, Marine Dumping-London Convention, Ozone Layer Protection, Ship Pollution, Wetlands, Whaling
- Signed, but not ratified
- none of the selected agreements
Particulate matter emissions
8 micrograms per cubic meter (2019 est.)
Protected areas
12 % of total land area
Renewable electricity output
16 % of total
Waste and recycling
- Municipal solid waste generated annually
- 35,700 tons (2024 est.)
- Percent of municipal solid waste recycled
- 15.4% (2022 est.)