Countries
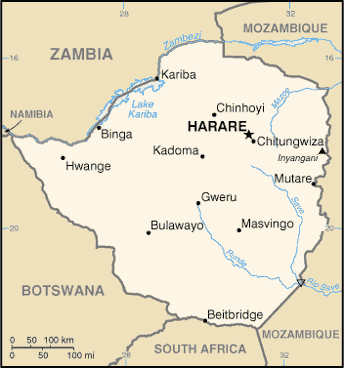
Zimbabwe

Key Economic Indicators
$98.61 billion
$5,928
1.74%
104.71%
9.29%
$44.188 billion (2024 est.)
69.9% of GDP (2016 est.)
$501.2 million
Economic Overview
low income Sub-Saharan economy; political instability and endemic corruption have prevented reforms and stalled debt restructuring; new Zimbabwe Gold (ZiG) currency latest effort to combat ongoing hyperinflation; reliant on natural resource extraction, agriculture and remittances
All Economic Data
Agricultural products
sugarcane, beef, maize, cabbages, potatoes, tomatoes, milk, onions, bananas, wheat (2023)
note:
<b>note:</b> top ten agricultural products based on tonnage
Budget
Expenditures:
$23 million (2018 est.)
Revenues:
$17 million (2018 est.)
Currency
code:
ZWL
name:
Zimbabwean dollar (ZWL) [$]
Current account balance
$501.2 million
Current account balance 2021:
$348.215 million (2021 est.)
Current account balance 2022:
$304.966 million (2022 est.)
Current account balance 2023:
$133.877 million (2023 est.)
Note:
<b>note:</b> balance of payments - net trade and primary/secondary income in current dollars
Debt - external
$14.4 billion
Debt - external 2023:
$6.671 billion (2023 est.)
Note:
<strong>note:</strong> present value of external debt in current US dollars
Exchange rates
Currency:
Zimbabwean dollars (ZWD) per US dollar -
Exchange rates 2020:
51.329 (2020 est.)
Exchange rates 2021:
88.552 (2021 est.)
Exchange rates 2022:
374.954 (2022 est.)
Exchange rates 2023:
3,509.172 (2023 est.)
Exchange rates 2024:
3,266.332 (2024 est.)
Note:
<strong>note: </strong>ongoing hyperinflation rendered Zimbabwean dollar essentially worthless; introduction of Zimbabwe Gold (ZiG) as new currency effective April 2024
Exports
$7.5 billion
Exports 2021:
$6.575 billion (2021 est.)
Exports 2022:
$7.453 billion (2022 est.)
Exports 2023:
$7.603 billion (2023 est.)
Note:
<strong>note:</strong> balance of payments - exports of goods and services in current dollars
Exports - commodities
gold, tobacco, nickel, minerals, diamonds (2023)
note:
<b>note:</b> top five export commodities based on value in dollars
Exports - partners
UAE 45%, China 18%, South Africa 15%, Mozambique 4%, Hong Kong 2% (2023)
note:
<b>note:</b> top five export partners based on percentage share of exports
Foreign direct investment
net inflows:
$465.43 million
GDP - composition, by end use
Exports of goods and services:
22.1% (2024 est.)
Government consumption:
12.5% (2024 est.)
Household consumption:
91.5% (2024 est.)
Imports of goods and services:
-30.6% (2024 est.)
Investment in fixed capital:
3.6% (2024 est.)
Investment in inventories:
0.9% (2024 est.)
Note:
<b>note:</b> figures may not total 100% due to rounding or gaps in data collection
GDP - composition, by sector of origin
Agriculture:
5.4% (2024 est.)
Industry:
31.8% (2024 est.)
Note:
<b>note:</b> figures may not total 100% due to non-allocated consumption not captured in sector-reported data
Services:
55.8% (2024 est.)
GDP (official exchange rate)
$44.188 billion (2024 est.)
note:
<b>note:</b> data in current dollars at official exchange rate
GDP per capita (nominal)
$2,497
Gini Index coefficient - distribution of family income
50.3 (2019)
Gini Index coefficient - distribution of family income 2020:
50.3 (2020 est.)
Note:
<b>note:</b> index (0-100) of income distribution; higher values represent greater inequality
GNI (gross national income)
$41.1 billion
GNI per capita
$2,400
Gross domestic investment
9 % of GDP
Household income or consumption by percentage share
Highest 10%:
34.8% (2017 est.)
Lowest 10%:
2.5% (2017 est.)
Note:
<b>note:</b> % share of income accruing to lowest and highest 10% of population
Imports
$9.74 billion
Imports 2021:
$8.104 billion (2021 est.)
Imports 2022:
$9.569 billion (2022 est.)
Imports 2023:
$10.293 billion (2023 est.)
Note:
<strong>note:</strong> balance of payments - imports of goods and services in current dollars
Imports - commodities
refined petroleum, fertilizers, trucks, soybean oil, stone processing machines (2023)
note:
<b>note:</b> top five import commodities based on value in dollars
Imports - partners
South Africa 37%, China 15%, Bahamas, The 5%, Singapore 5%, UAE 4% (2023)
note:
<b>note:</b> top five import partners based on percentage share of imports
Industrial production growth rate
2.7% (2024 est.)
note:
<b>note:</b> annual % change in industrial value added based on constant local currency
Industries
mining (coal, gold, platinum, copper, nickel, tin, diamonds, clay, numerous metallic and nonmetallic ores), steel, wood products, cement, chemicals, fertilizer, clothing and footwear, foodstuffs, beverages
Inflation rate (consumer prices)
104.71%
Inflation rate (consumer prices) 2020:
557.2% (2020 est.)
Inflation rate (consumer prices) 2021:
98.5% (2021 est.)
Inflation rate (consumer prices) 2022:
104.7% (2022 est.)
Note:
<b>note:</b> annual % change based on consumer prices
Labor force
6.386 million (2024 est.)
note:
<b>note:</b> number of people ages 15 or older who are employed or seeking work
total:
6.85 million persons
Labor force - by occupation
agriculture:
54.31%
industry:
11.53%
services:
34.16%
Population below poverty line
38.3% (2019 est.)
note:
<b>note:</b> % of population with income below national poverty line
Public debt
Public debt 2016:
69.9% of GDP (2016 est.)
Real GDP (purchasing power parity)
$98.61 billion
Note:
<b>note:</b> data in 2021 dollars
Real GDP (purchasing power parity) 2022:
$53.399 billion (2022 est.)
Real GDP (purchasing power parity) 2023:
$56.249 billion (2023 est.)
Real GDP (purchasing power parity) 2024:
$57.391 billion (2024 est.)
Real GDP growth rate
1.74%
Note:
<b>note:</b> annual GDP % growth based on constant local currency
Real GDP growth rate 2022:
6.1% (2022 est.)
Real GDP growth rate 2023:
5.3% (2023 est.)
Real GDP growth rate 2024:
2% (2024 est.)
Real GDP per capita
$5,928
Note:
<b>note:</b> data in 2021 dollars
Real GDP per capita 2022:
$3,300 (2022 est.)
Real GDP per capita 2023:
$3,400 (2023 est.)
Real GDP per capita 2024:
$3,500 (2024 est.)
Remittances
$3.51 billion
Note:
<b>note:</b> personal transfers and compensation between resident and non-resident individuals/households/entities
Remittances 2021:
9.4% of GDP (2021 est.)
Remittances 2022:
9.4% of GDP (2022 est.)
Remittances 2023:
9.4% of GDP (2023 est.)
Reserves of foreign exchange and gold
$484.97 million
Note:
<b>note:</b> holdings of gold (year-end prices)/foreign exchange/special drawing rights in current dollars
Reserves of foreign exchange and gold 2022:
$598.622 million (2022 est.)
Reserves of foreign exchange and gold 2023:
$115.53 million (2023 est.)
Reserves of foreign exchange and gold 2024:
$484.973 million (2024 est.)
Taxes and other revenues
7.2% (of GDP) (2018 est.)
note:
<b>note:</b> central government tax revenue as a % of GDP
Unemployment rate
9.29%
Note:
<b>note:</b> % of labor force seeking employment
Unemployment rate 2022:
10.1% (2022 est.)
Unemployment rate 2023:
8.8% (2023 est.)
Unemployment rate 2024:
8.6% (2024 est.)
Youth unemployment rate (ages 15-24)
Female:
15.4% (2024 est.)
Male:
12.9% (2024 est.)
Note:
<b>note:</b> % of labor force ages 15-24 seeking employment
Total:
14% (2024 est.)
Economic Rankings
Inflation Rate
#2
Gini Index
#16
Unemployment Rate
#43
External Debt
#58
GDP Growth Rate
#62
GDP (Nominal)
#98
GDP (PPP)
#101
Imports
#123
Exports
#125
GDP per Capita
#150
Reserves
#154
Quick Facts
Industries
mining (coal, gold, platinum, copper, nickel, tin, diamonds, clay, numerous metallic and nonmetallic ores), steel, wood products, cement, chemicals, fertilizer, clothing and footwear, foodstuffs, beve
Agricultural products
sugarcane, beef, maize, cabbages, potatoes, tomatoes, milk, onions, bananas, wheat (2023)
Labor force
6.386 million (2024 est.)
Exports - partners
UAE 45%, China 18%, South Africa 15%, Mozambique 4%, Hong Kong 2% (2023)
Imports - partners
South Africa 37%, China 15%, Bahamas, The 5%, Singapore 5%, UAE 4% (2023)
Exchange rates
Zimbabwean dollars (ZWD) per US dollar -
Explore More
Our Partners
Trusted partner applications powering global data and insights