Countries
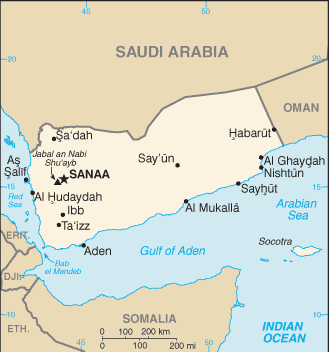
Yemen

Key Economic Indicators
<strong>note:</strong> data in 2015 dollars
<strong>note:</strong> data in 2015 dollars
<b>note:</b> annual GDP % growth based on constant local currency
19.6% (2020 est.)
17.32%
$8.278 billion (2024 est.)
68.1% of GDP (2016 est.)
-$1.488 billion (2014 est.)
Economic Overview
low-income Middle Eastern economy; infrastructure, trade, and economic institutions devastated by civil war; oil/gas-dependent but decreasing reserves; massive poverty, food insecurity, and unemployment; high inflation
All Economic Data
Agricultural products
mangoes/guavas, potatoes, milk, onions, spices, chicken, sorghum, watermelons, tomatoes, grapes (2023)
note:
<b>note:</b> top ten agricultural products based on tonnage
Budget
Expenditures:
$3.585 billion (2019 est.)
Revenues:
$2.207 billion (2019 est.)
Currency
code:
YER
name:
Yemeni rial (YER) [﷼]
Current account balance
Current account balance 2014:
-$1.488 billion (2014 est.)
Current account balance 2015:
-$3.026 billion (2015 est.)
Current account balance 2016:
-$2.419 billion (2016 est.)
Note:
<b>note:</b> balance of payments - net trade and primary/secondary income in current dollars
Debt - external
$7.09 billion
Debt - external 2023:
$6.492 billion (2023 est.)
Note:
<b>note:</b> present value of external debt in current US dollars
Exchange rates
Currency:
Yemeni rials (YER) per US dollar -
Exchange rates 2019:
486.731 (2019 est.)
Exchange rates 2020:
743.006 (2020 est.)
Exchange rates 2021:
1,028.108 (2021 est.)
Exchange rates 2022:
1,115.002 (2022 est.)
Exchange rates 2023:
1,355.116 (2023 est.)
Exports
Exports 2015:
$1.867 billion (2015 est.)
Exports 2016:
$938.469 million (2016 est.)
Exports 2017:
$384.5 million (2017 est.)
Note:
<b>note:</b> balance of payments - exports of goods and services in current dollars
Exports - commodities
gold, fish, scrap iron, shellfish, industrial acids/oils/alcohols (2023)
note:
<b>note:</b> top five export commodities based on value in dollars
Exports - partners
UAE 28%, India 21%, Saudi Arabia 17%, Oman 7%, Malaysia 5% (2023)
note:
<b>note:</b> top five export partners based on percentage share of exports
GDP - composition, by sector of origin
Agriculture:
28.7% (2018 est.)
Industry:
25.4% (2018 est.)
Note:
<b>note:</b> figures may not total 100% due to non-allocated consumption not captured in sector-reported data
Services:
41.8% (2018 est.)
GDP (official exchange rate)
$8.278 billion (2024 est.)
note:
<b>note:</b> data in current dollars at official exchange rate
Gini Index coefficient - distribution of family income
36.7 (2014)
Imports
Imports 2015:
$7.697 billion (2015 est.)
Imports 2016:
$8.256 billion (2016 est.)
Imports 2017:
$4.079 billion (2017 est.)
Note:
<b>note:</b> balance of payments - imports of goods and services in current dollars
Imports - commodities
wheat, raw sugar, rice, iron bars, plastic products (2023)
note:
<b>note:</b> top five import commodities based on value in dollars
Imports - partners
China 23%, UAE 15%, Saudi Arabia 11%, Turkey 8%, India 7% (2023)
note:
<b>note:</b> top five import partners based on percentage share of imports
Industrial production growth rate
-1.1% (2018 est.)
note:
<b>note:</b> annual % change in industrial value added based on constant local currency
Industries
crude oil production and petroleum refining; small-scale production of cotton textiles, leather goods; food processing; handicrafts; aluminum products; cement; commercial ship repair; natural gas production
Inflation rate (consumer prices)
Inflation rate (consumer prices) 2020:
19.6% (2020 est.)
Inflation rate (consumer prices) 2021:
26% (2021 est.)
Inflation rate (consumer prices) 2022:
29.1% (2022 est.)
Note:
<strong>note:</strong> annual % change based on consumer prices
Labor force
7.848 million (2024 est.)
note:
<b>note:</b> number of people ages 15 or older who are employed or seeking work
total:
8.16 million persons
Labor force - by occupation
agriculture:
31.62%
industry:
11.13%
services:
57.25%
Public debt
Public debt 2016:
68.1% of GDP (2016 est.)
Real GDP (purchasing power parity)
Note:
<strong>note:</strong> data in 2015 dollars
Real GDP (purchasing power parity) 2022:
$19.294 billion (2022 est.)
Real GDP (purchasing power parity) 2023:
$18.908 billion (2023 est.)
Real GDP (purchasing power parity) 2024:
$18.719 billion (2024 est.)
Real GDP growth rate
Note:
<b>note:</b> annual GDP % growth based on constant local currency
Real GDP growth rate 2016:
-9.4% (2016 est.)
Real GDP growth rate 2017:
-5.1% (2017 est.)
Real GDP growth rate 2018:
0.8% (2018 est.)
Real GDP per capita
Note:
<strong>note:</strong> data in 2015 dollars
Real GDP per capita 2022:
$300 (2022 est.)
Real GDP per capita 2023:
$200 (2023 est.)
Real GDP per capita 2024:
$200 (2024 est.)
Remittances
$3.43 billion
Note:
<b>note:</b> personal transfers and compensation between resident and non-resident individuals/households/entities
Remittances 2021:
19.44% of GDP (2021 est.)
Remittances 2022:
16.02% of GDP (2022 est.)
Remittances 2023:
20.05% of GDP (2023 est.)
Reserves of foreign exchange and gold
$1.25 billion
Note:
<b>note:</b> holdings of gold (year-end prices)/foreign exchange/special drawing rights in current dollars
Reserves of foreign exchange and gold 2020:
$969.613 million (2020 est.)
Reserves of foreign exchange and gold 2021:
$1.688 billion (2021 est.)
Reserves of foreign exchange and gold 2022:
$1.251 billion (2022 est.)
Unemployment rate
17.32%
Note:
<b>note:</b> % of labor force seeking employment
Unemployment rate 2022:
17.4% (2022 est.)
Unemployment rate 2023:
17.1% (2023 est.)
Unemployment rate 2024:
17.1% (2024 est.)
Youth unemployment rate (ages 15-24)
Female:
38.4% (2024 est.)
Male:
31.8% (2024 est.)
Note:
<b>note:</b> % of labor force ages 15-24 seeking employment
Total:
32.4% (2024 est.)
Economic Rankings
Unemployment Rate
#13
Inflation Rate
#24
External Debt
#75
Gini Index
#93
Reserves
#129
Imports
#132
GDP (PPP)
#152
GDP (Nominal)
#153
Exports
#161
GDP Growth Rate
#186
GDP per Capita
#191
Quick Facts
Industries
crude oil production and petroleum refining; small-scale production of cotton textiles, leather goods; food processing; handicrafts; aluminum products; cement; commercial ship repair; natural gas prod
Agricultural products
mangoes/guavas, potatoes, milk, onions, spices, chicken, sorghum, watermelons, tomatoes, grapes (2023)
Labor force
7.848 million (2024 est.)
Exports - partners
UAE 28%, India 21%, Saudi Arabia 17%, Oman 7%, Malaysia 5% (2023)
Imports - partners
China 23%, UAE 15%, Saudi Arabia 11%, Turkey 8%, India 7% (2023)
Exchange rates
Yemeni rials (YER) per US dollar -
Explore More
Our Partners
Trusted partner applications powering global data and insights