Countries
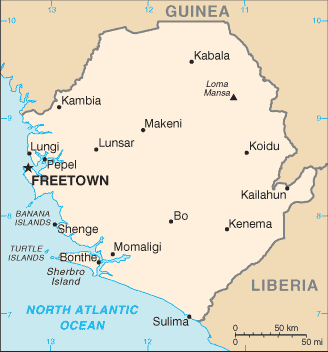
Sierra Leone

Key Economic Indicators
$30.44 billion
$3,522
4.29%
28.63%
3.15%
$7.548 billion (2024 est.)
54.9% of GDP (2016 est.)
$-606,358,361
Economic Overview
low-income West African economy; primarily subsistent agriculture; key iron and diamond mining activities suspended; slow recovery from 1990s civil war; systemic corruption; high-risk debt; high youth unemployment; natural resource rich
All Economic Data
Agricultural products
cassava, rice, oil palm fruit, vegetables, sweet potatoes, milk, citrus fruits, fruits, groundnuts, sugarcane (2023)
note:
<b>note:</b> top ten agricultural products based on tonnage
Budget
Expenditures:
$867 million (2019 est.)
Revenues:
$740 million (2019 est.)
Currency
code:
SLE
name:
Leone (SLE) [Le]
Current account balance
$-606,358,361
Current account balance 2021:
-$522.815 million (2021 est.)
Current account balance 2022:
-$452.094 million (2022 est.)
Current account balance 2023:
-$606.358 million (2023 est.)
Note:
<b>note:</b> balance of payments - net trade and primary/secondary income in current dollars
Debt - external
$2.33 billion
Debt - external 2023:
$1.451 billion (2023 est.)
Note:
<b>note:</b> present value of external debt in current US dollars
Exchange rates
Currency:
leones (SLL) per US dollar -
Exchange rates 2019:
9.01 (2019 est.)
Exchange rates 2020:
9.83 (2020 est.)
Exchange rates 2021:
10.439 (2021 est.)
Exchange rates 2022:
14.048 (2022 est.)
Exchange rates 2023:
21.305 (2023 est.)
Exports
$1.2 billion
Exports 2021:
$928.689 million (2021 est.)
Exports 2022:
$1.202 billion (2022 est.)
Exports 2023:
$1.382 billion (2023 est.)
Note:
<b>note:</b> balance of payments - exports of goods and services in current dollars
Exports - commodities
iron ore, titanium ore, diamonds, aluminum ore, cocoa beans (2023)
note:
<b>note:</b> top five export commodities based on value in dollars
Exports - partners
China 67%, India 6%, Belgium 5%, Netherlands 4%, Ireland 3% (2023)
note:
<b>note:</b> top five export partners based on percentage share of exports
Foreign direct investment
net inflows:
$121.79 million
GDP - composition, by end use
Exports of goods and services:
20.9% (2024 est.)
Government consumption:
5.5% (2024 est.)
Household consumption:
87.6% (2024 est.)
Imports of goods and services:
-43.5% (2024 est.)
Investment in fixed capital:
29.5% (2024 est.)
Investment in inventories:
0% (2024 est.)
Note:
<b>note:</b> figures may not total 100% due to rounding or gaps in data collection
GDP - composition, by sector of origin
Agriculture:
25.4% (2024 est.)
Industry:
27.3% (2024 est.)
Note:
<b>note:</b> figures may not total 100% due to non-allocated consumption not captured in sector-reported data
Services:
44.8% (2024 est.)
GDP (official exchange rate)
$7.548 billion (2024 est.)
note:
<b>note:</b> data in current dollars at official exchange rate
GDP per capita (nominal)
$807
Gini Index coefficient - distribution of family income
35.7 (2018)
Gini Index coefficient - distribution of family income 2018:
35.7 (2018 est.)
Note:
<b>note:</b> index (0-100) of income distribution; higher values represent greater inequality
GNI (gross national income)
$6.91 billion
GNI per capita
$820
Gross domestic investment
20 % of GDP
Household income or consumption by percentage share
Highest 10%:
29.4% (2018 est.)
Lowest 10%:
3.4% (2018 est.)
Note:
<b>note:</b> % share of income accruing to lowest and highest 10% of population
Imports
$1.62 billion
Imports 2021:
$1.91 billion (2021 est.)
Imports 2022:
$2.074 billion (2022 est.)
Imports 2023:
$2.264 billion (2023 est.)
Note:
<b>note:</b> balance of payments - imports of goods and services in current dollars
Imports - commodities
rice, plastic products, packaged medicine, cement, cars (2023)
note:
<b>note:</b> top five import commodities based on value in dollars
Imports - partners
China 32%, India 15%, UAE 5%, USA 5%, Turkey 5% (2023)
note:
<b>note:</b> top five import partners based on percentage share of imports
Industrial production growth rate
4.7% (2024 est.)
note:
<b>note:</b> annual % change in industrial value added based on constant local currency
Industries
diamond mining; iron ore, rutile and bauxite mining; small-scale manufacturing (beverages, textiles, footwear)
Inflation rate (consumer prices)
28.63%
Inflation rate (consumer prices) 2022:
27.2% (2022 est.)
Inflation rate (consumer prices) 2023:
47.6% (2023 est.)
Inflation rate (consumer prices) 2024:
28.6% (2024 est.)
Note:
<b>note:</b> annual % change based on consumer prices
Labor force
2.863 million (2024 est.)
note:
<b>note:</b> number of people ages 15 or older who are employed or seeking work
total:
2.93 million persons
Labor force - by occupation
agriculture:
44.49%
industry:
11.47%
services:
44.04%
Population below poverty line
56.8% (2018 est.)
note:
<b>note:</b> % of population with income below national poverty line
Public debt
Public debt 2016:
54.9% of GDP (2016 est.)
Real GDP (purchasing power parity)
$30.44 billion
Note:
<b>note:</b> data in 2021 dollars
Real GDP (purchasing power parity) 2022:
$24.312 billion (2022 est.)
Real GDP (purchasing power parity) 2023:
$25.7 billion (2023 est.)
Real GDP (purchasing power parity) 2024:
$26.728 billion (2024 est.)
Real GDP growth rate
4.29%
Note:
<b>note:</b> annual GDP % growth based on constant local currency
Real GDP growth rate 2022:
5.3% (2022 est.)
Real GDP growth rate 2023:
5.7% (2023 est.)
Real GDP growth rate 2024:
4% (2024 est.)
Real GDP per capita
$3,522
Note:
<b>note:</b> data in 2021 dollars
Real GDP per capita 2022:
$2,900 (2022 est.)
Real GDP per capita 2023:
$3,000 (2023 est.)
Real GDP per capita 2024:
$3,100 (2024 est.)
Remittances
$320.83 million
Note:
<b>note:</b> personal transfers and compensation between resident and non-resident individuals/households/entities
Remittances 2021:
2.6% of GDP (2021 est.)
Remittances 2022:
4.1% of GDP (2022 est.)
Remittances 2023:
4.6% of GDP (2023 est.)
Reserves of foreign exchange and gold
$495.7 million
Note:
<b>note:</b> holdings of gold (year-end prices)/foreign exchange/special drawing rights in current dollars
Reserves of foreign exchange and gold 2021:
$945.908 million (2021 est.)
Reserves of foreign exchange and gold 2022:
$624.496 million (2022 est.)
Reserves of foreign exchange and gold 2023:
$495.699 million (2023 est.)
Unemployment rate
3.15%
Note:
<b>note:</b> % of labor force seeking employment
Unemployment rate 2022:
3.2% (2022 est.)
Unemployment rate 2023:
3.2% (2023 est.)
Unemployment rate 2024:
3.2% (2024 est.)
Youth unemployment rate (ages 15-24)
Female:
2.5% (2024 est.)
Male:
4.8% (2024 est.)
Note:
<b>note:</b> % of labor force ages 15-24 seeking employment
Total:
3.6% (2024 est.)
World Bank Indicators
Broad Money
20.33 (2024)
Currency
Leone (SLE) Le (2025)
Current Account Balance (US$)
-984,255,892.69 (2024)
Exchange Rate
21.30 (2023)
Exports (US$)
$1.20B (2024)
External Debt
$2.33B (2024)
FDI Net Inflows (US$)
1.75 (2024)
GDP Growth (%)
4.29 (2024)
GDP Per Capita
807 (2024)
GDP (Current US$)
$6.97B (2024)
Gini Index
35.70 (2018)
Imports (US$)
$1.62B (2024)
Inflation Rate (%)
28.63 (2024)
Languages
English (2025)
Population
$8.64M (2024)
Reserves
$433.27M (2024)
Trade Pct Gdp
40.55 (2024)
Unemployment Rate (%)
3.15 (2025)
Youth Unemployment
3.72 (2025)
Economic Rankings
Inflation Rate
#13
GDP Growth Rate
#65
External Debt
#100
Gini Index
#103
Reserves
#142
Unemployment Rate
#145
GDP (PPP)
#148
GDP (Nominal)
#155
Imports
#162
Exports
#166
GDP per Capita
#168
Quick Facts
Industries
diamond mining; iron ore, rutile and bauxite mining; small-scale manufacturing (beverages, textiles, footwear)
Agricultural products
cassava, rice, oil palm fruit, vegetables, sweet potatoes, milk, citrus fruits, fruits, groundnuts, sugarcane (2023)
Labor force
2.863 million (2024 est.)
Exports - partners
China 67%, India 6%, Belgium 5%, Netherlands 4%, Ireland 3% (2023)
Imports - partners
China 32%, India 15%, UAE 5%, USA 5%, Turkey 5% (2023)
Exchange rates
leones (SLL) per US dollar -
Explore More
Our Partners
Trusted partner applications powering global data and insights