Countries
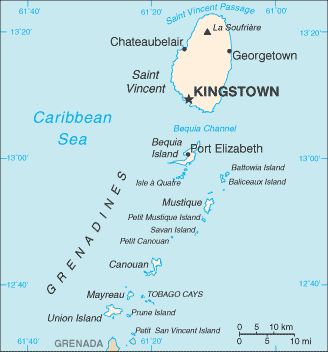
Saint Vincent and the Grenadines

Key Economic Indicators
$2.14 billion
$21,272
4.06%
3.63%
18%
$1.157 billion (2024 est.)
82.8% of GDP (2016 est.)
$-156,588,993
Economic Overview
upper middle-income Caribbean island economy; key agriculture and tourism sectors; environmentally fragile; diversifying economy across services, science and knowledge, and creative industries; CARICOM member and US Caribbean Basin Initiative beneficiary
All Economic Data
Agricultural products
bananas, root vegetables, plantains, spices, coconuts, fruits, apples, vegetables, mangoes/guavas, sweet potatoes (2023)
note:
<b>note:</b> top ten agricultural products based on tonnage
Budget
Expenditures:
$208.744 million (2017 est.)
Note:
<b>note:</b> central government revenues and expenses (excluding grants/extrabudgetary units/social security funds) converted to US dollars at average official exchange rate for year indicated
Revenues:
$226.404 million (2017 est.)
Currency
code:
XCD
name:
Eastern Caribbean dollar (XCD) [$]
Current account balance
$-156,588,993
Current account balance 2022:
-$199.727 million (2022 est.)
Current account balance 2023:
-$180.43 million (2023 est.)
Current account balance 2024:
-$156.589 million (2024 est.)
Note:
<b>note:</b> balance of payments - net trade and primary/secondary income in current dollars
Debt - external
$806.45 million
Debt - external 2023:
$456.971 million (2023 est.)
Note:
<b>note:</b> present value of external debt in current US dollars
Exchange rates
Currency:
East Caribbean dollars (XCD) per US dollar -
Exchange rates 2020:
2.7 (2020 est.)
Exchange rates 2021:
2.7 (2021 est.)
Exchange rates 2022:
2.7 (2022 est.)
Exchange rates 2023:
2.7 (2023 est.)
Exchange rates 2024:
2.7 (2024 est.)
Exports
Exports 2022:
$278.292 million (2022 est.)
Exports 2023:
$345.098 million (2023 est.)
Exports 2024:
$425.182 million (2024 est.)
Note:
<b>note:</b> balance of payments - exports of goods and services in current dollars
Exports - commodities
ships, wheat flours, animal food, shellfish, construction vehicles (2023)
note:
<b>note:</b> top five export commodities based on value in dollars
Exports - partners
Croatia 16%, Barbados 14%, USA 10%, St. Lucia 10%, St. Kitts & Nevis 8% (2023)
note:
<b>note:</b> top five export partners based on percentage share of exports
Foreign direct investment
net inflows:
$138.93 million
GDP - composition, by sector of origin
Agriculture:
3.5% (2024 est.)
Industry:
15.4% (2024 est.)
Note:
<b>note:</b> figures may not total 100% due to non-allocated consumption not captured in sector-reported data
Services:
66.4% (2024 est.)
GDP (official exchange rate)
$1.157 billion (2024 est.)
note:
<b>note:</b> data in current dollars at official exchange rate
GDP per capita (nominal)
$11,501
GNI (gross national income)
$1.15 billion
GNI per capita
$11,060
Imports
Imports 2022:
$540.833 million (2022 est.)
Imports 2023:
$588.865 million (2023 est.)
Imports 2024:
$641.179 million (2024 est.)
Note:
<b>note:</b> balance of payments - imports of goods and services in current dollars
Imports - commodities
ships, refined petroleum, wheat, coal, poultry (2023)
note:
<b>note:</b> top five import commodities based on value in dollars
Imports - partners
USA 37%, Italy 7%, Trinidad & Tobago 7%, China 6%, UK 6% (2023)
note:
<b>note:</b> top five import partners based on percentage share of imports
Industrial production growth rate
7.3% (2024 est.)
note:
<b>note:</b> annual % change in industrial value added based on constant local currency
Industries
tourism; food processing, cement, furniture, clothing, starch
Inflation rate (consumer prices)
3.63%
Inflation rate (consumer prices) 2022:
5.7% (2022 est.)
Inflation rate (consumer prices) 2023:
4.6% (2023 est.)
Inflation rate (consumer prices) 2024:
3.6% (2024 est.)
Note:
<b>note:</b> annual % change based on consumer prices
Labor force
52,100 (2024 est.)
note:
<b>note:</b> number of people ages 15 or older who are employed or seeking work
total:
53,688 persons
Labor force - by occupation
agriculture:
9.07%
industry:
21.13%
services:
69.79%
Public debt
Public debt 2016:
82.8% of GDP (2016 est.)
Real GDP (purchasing power parity)
$2.14 billion
Note:
<b>note:</b> data in 2021 dollars
Real GDP (purchasing power parity) 2022:
$1.718 billion (2022 est.)
Real GDP (purchasing power parity) 2023:
$1.809 billion (2023 est.)
Real GDP (purchasing power parity) 2024:
$1.883 billion (2024 est.)
Real GDP growth rate
4.06%
Note:
<b>note:</b> annual GDP % growth based on constant local currency
Real GDP growth rate 2022:
3.1% (2022 est.)
Real GDP growth rate 2023:
5.3% (2023 est.)
Real GDP growth rate 2024:
4.1% (2024 est.)
Real GDP per capita
$21,272
Note:
<b>note:</b> data in 2021 dollars
Real GDP per capita 2022:
$16,800 (2022 est.)
Real GDP per capita 2023:
$17,900 (2023 est.)
Real GDP per capita 2024:
$18,700 (2024 est.)
Remittances
$91.89 million
Note:
<b>note:</b> personal transfers and compensation between resident and non-resident individuals/households/entities
Remittances 2022:
9% of GDP (2022 est.)
Remittances 2023:
8.5% of GDP (2023 est.)
Remittances 2024:
8.2% of GDP (2024 est.)
Reserves of foreign exchange and gold
$316.82 million
Note:
<b>note:</b> holdings of gold (year-end prices)/foreign exchange/special drawing rights in current dollars
Reserves of foreign exchange and gold 2022:
$320.193 million (2022 est.)
Reserves of foreign exchange and gold 2023:
$280.564 million (2023 est.)
Reserves of foreign exchange and gold 2024:
$316.824 million (2024 est.)
Taxes and other revenues
23.8% (of GDP) (2017 est.)
note:
<b>note:</b> central government tax revenue as a % of GDP
Unemployment rate
18%
Note:
<b>note:</b> % of labor force seeking employment
Unemployment rate 2022:
19.5% (2022 est.)
Unemployment rate 2023:
18.6% (2023 est.)
Unemployment rate 2024:
18.1% (2024 est.)
Youth unemployment rate (ages 15-24)
Female:
41.4% (2024 est.)
Male:
41.4% (2024 est.)
Note:
<b>note:</b> % of labor force ages 15-24 seeking employment
Total:
41.4% (2024 est.)
World Bank Indicators
Currency
Eastern Caribbean dollar (XCD) $ (2025)
Languages
English (2025)
Economic Rankings
Unemployment Rate
#9
GDP Growth Rate
#87
GDP per Capita
#89
External Debt
#113
Inflation Rate
#150
Reserves
#167
Imports
#178
Exports
#179
GDP (PPP)
#183
GDP (Nominal)
#183
Quick Facts
Industries
tourism; food processing, cement, furniture, clothing, starch
Agricultural products
bananas, root vegetables, plantains, spices, coconuts, fruits, apples, vegetables, mangoes/guavas, sweet potatoes (2023)
Labor force
52,100 (2024 est.)
Exports - partners
Croatia 16%, Barbados 14%, USA 10%, St. Lucia 10%, St. Kitts & Nevis 8% (2023)
Imports - partners
USA 37%, Italy 7%, Trinidad & Tobago 7%, China 6%, UK 6% (2023)
Exchange rates
East Caribbean dollars (XCD) per US dollar -
Explore More
Our Partners
Trusted partner applications powering global data and insights