Countries
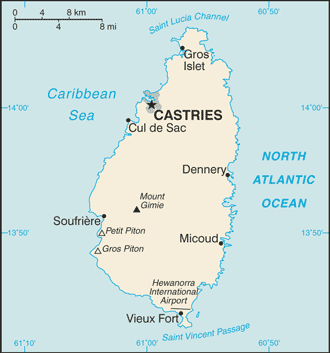
Saint Lucia

Key Economic Indicators
$4.96 billion
$27,567
3.89%
-0.11%
9.45%
$2.549 billion (2024 est.)
69.2% of GDP (2016 est.)
$-64,121,335
Economic Overview
upper middle-income, tourism-based Caribbean island economy; environmentally fragile; energy import-dependent; major banana producer; well-educated labor force; key infrastructure, IT, and communications investments
All Economic Data
Agricultural products
coconuts, bananas, tropical fruits, fruits, root vegetables, plantains, vegetables, cassava, chicken, milk (2023)
note:
<b>note:</b> top ten agricultural products based on tonnage
Budget
Expenditures:
$351.956 million (2017 est.)
Note:
<b>note:</b> central government revenues and expenses (excluding grants/extrabudgetary units/social security funds) converted to US dollars at average official exchange rate for year indicated
Revenues:
$414.77 million (2017 est.)
Currency
code:
XCD
name:
Eastern Caribbean dollar (XCD) [$]
Current account balance
$-64,121,335
Current account balance 2022:
-$83.442 million (2022 est.)
Current account balance 2023:
-$38.069 million (2023 est.)
Current account balance 2024:
-$64.121 million (2024 est.)
Note:
<b>note:</b> balance of payments - net trade and primary/secondary income in current dollars
Debt - external
$1.19 billion
Debt - external 2023:
$901.317 million (2023 est.)
Note:
<strong>note:</strong> present value of external debt in current US dollars
Exchange rates
Currency:
East Caribbean dollars (XCD) per US dollar -
Exchange rates 2020:
2.7 (2020 est.)
Exchange rates 2021:
2.7 (2021 est.)
Exchange rates 2022:
2.7 (2022 est.)
Exchange rates 2023:
2.7 (2023 est.)
Exchange rates 2024:
2.7 (2024 est.)
Exports
Exports 2022:
$1.29 billion (2022 est.)
Exports 2023:
$1.419 billion (2023 est.)
Exports 2024:
$1.6 billion (2024 est.)
Note:
<b>note:</b> balance of payments - exports of goods and services in current dollars
Exports - commodities
refined petroleum, gravel and crushed stone, beer, liquor, paper containers (2023)
note:
<b>note:</b> top five export commodities based on value in dollars
Exports - partners
Guyana 20%, Suriname 15%, USA 11%, Barbados 8%, Dominica 7% (2023)
note:
<b>note:</b> top five export partners based on percentage share of exports
Foreign direct investment
net inflows:
$186.61 million
GDP - composition, by end use
Exports of goods and services:
62.7% (2017 est.)
Government consumption:
11.2% (2017 est.)
Household consumption:
66.1% (2017 est.)
Imports of goods and services:
-56.9% (2017 est.)
Investment in fixed capital:
16.9% (2017 est.)
Investment in inventories:
0.1% (2017 est.)
GDP - composition, by sector of origin
Agriculture:
1.1% (2024 est.)
Industry:
9.8% (2024 est.)
Note:
<b>note:</b> figures may not total 100% due to non-allocated consumption not captured in sector-reported data
Services:
75.9% (2024 est.)
GDP (official exchange rate)
$2.549 billion (2024 est.)
note:
<b>note:</b> data in current dollars at official exchange rate
GDP per capita (nominal)
$14,182
Gini Index coefficient - distribution of family income
51.2 (2016)
Gini Index coefficient - distribution of family income 2016:
51.2 (2016 est.)
Note:
<b>note:</b> index (0-100) of income distribution; higher values represent greater inequality
GNI (gross national income)
$2.3 billion
GNI per capita
$12,640
Household income or consumption by percentage share
Highest 10%:
34.1% (2015 est.)
Lowest 10%:
2.1% (2015 est.)
Note:
<strong>note:</strong> % share of income accruing to lowest and highest 10% of population
Imports
Imports 2022:
$1.2 billion (2022 est.)
Imports 2023:
$1.292 billion (2023 est.)
Imports 2024:
$1.446 billion (2024 est.)
Note:
<b>note:</b> balance of payments - imports of goods and services in current dollars
Imports - commodities
refined petroleum, crude petroleum, cars, poultry, plastic products (2023)
note:
<b>note:</b> top five import commodities based on value in dollars
Imports - partners
USA 59%, Guyana 8%, Brazil 7%, China 5%, UK 3% (2023)
note:
<b>note:</b> top five import partners based on percentage share of imports
Industrial production growth rate
5.6% (2024 est.)
note:
<b>note:</b> annual % change in industrial value added based on constant local currency
Industries
tourism; clothing, assembly of electronic components, beverages, corrugated cardboard boxes, lime processing, coconut processing
Inflation rate (consumer prices)
-0.11%
Inflation rate (consumer prices) 2022:
6.4% (2022 est.)
Inflation rate (consumer prices) 2023:
4.1% (2023 est.)
Inflation rate (consumer prices) 2024:
-0.1% (2024 est.)
Note:
<b>note:</b> annual % change based on consumer prices
Labor force
102,400 (2024 est.)
note:
<b>note:</b> number of people ages 15 or older who are employed or seeking work
total:
101,771 persons
Labor force - by occupation
agriculture:
7.47%
industry:
16.21%
services:
76.32%
Population below poverty line
25% (2015 est.)
note:
<b>note:</b> % of population with income below national poverty line
Public debt
Public debt 2016:
69.2% of GDP (2016 est.)
Real GDP (purchasing power parity)
$4.96 billion
Note:
<b>note:</b> data in 2021 dollars
Real GDP (purchasing power parity) 2022:
$4.105 billion (2022 est.)
Real GDP (purchasing power parity) 2023:
$4.196 billion (2023 est.)
Real GDP (purchasing power parity) 2024:
$4.359 billion (2024 est.)
Real GDP growth rate
3.89%
Note:
<b>note:</b> annual GDP % growth based on constant local currency
Real GDP growth rate 2022:
20.4% (2022 est.)
Real GDP growth rate 2023:
2.2% (2023 est.)
Real GDP growth rate 2024:
3.9% (2024 est.)
Real GDP per capita
$27,567
Note:
<b>note:</b> data in 2021 dollars
Real GDP per capita 2022:
$23,000 (2022 est.)
Real GDP per capita 2023:
$23,400 (2023 est.)
Real GDP per capita 2024:
$24,300 (2024 est.)
Remittances
$60.64 million
Note:
<b>note:</b> personal transfers and compensation between resident and non-resident individuals/households/entities
Remittances 2022:
2.6% of GDP (2022 est.)
Remittances 2023:
2.6% of GDP (2023 est.)
Remittances 2024:
2.5% of GDP (2024 est.)
Reserves of foreign exchange and gold
$406.06 million
Note:
<b>note:</b> holdings of gold (year-end prices)/foreign exchange/special drawing rights in current dollars
Reserves of foreign exchange and gold 2022:
$389.083 million (2022 est.)
Reserves of foreign exchange and gold 2023:
$424.324 million (2023 est.)
Reserves of foreign exchange and gold 2024:
$406.064 million (2024 est.)
Taxes and other revenues
18.2% (of GDP) (2017 est.)
note:
<b>note:</b> central government tax revenue as a % of GDP
Unemployment rate
9.45%
Note:
<b>note:</b> % of labor force seeking employment
Unemployment rate 2022:
16% (2022 est.)
Unemployment rate 2023:
11.1% (2023 est.)
Unemployment rate 2024:
11% (2024 est.)
Youth unemployment rate (ages 15-24)
Female:
26.3% (2024 est.)
Male:
31.4% (2024 est.)
Note:
<b>note:</b> % of labor force ages 15-24 seeking employment
Total:
29% (2024 est.)
World Bank Indicators
Currency
So Tome and Principe dobra (STN) Db (2025)
Gini Index
56.30 (2017)
Languages
Portuguese (2025)
Economic Rankings
GDP Growth Rate
#3
Gini Index
#14
Unemployment Rate
#16
GDP per Capita
#71
External Debt
#109
Inflation Rate
#133
Reserves
#161
Exports
#164
GDP (Nominal)
#169
Imports
#171
GDP (PPP)
#175
Quick Facts
Industries
tourism; clothing, assembly of electronic components, beverages, corrugated cardboard boxes, lime processing, coconut processing
Agricultural products
coconuts, bananas, tropical fruits, fruits, root vegetables, plantains, vegetables, cassava, chicken, milk (2023)
Labor force
102,400 (2024 est.)
Exports - partners
Guyana 20%, Suriname 15%, USA 11%, Barbados 8%, Dominica 7% (2023)
Imports - partners
USA 59%, Guyana 8%, Brazil 7%, China 5%, UK 3% (2023)
Exchange rates
East Caribbean dollars (XCD) per US dollar -
Explore More
Our Partners
Trusted partner applications powering global data and insights