Countries
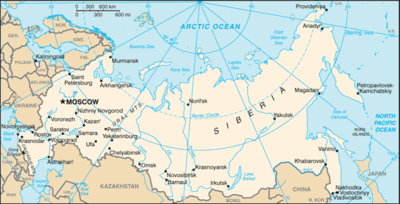
Russia

Key Economic Indicators
$6.92 trillion
$47,405
4.34%
8.43%
2.13%
$2.174 trillion (2024 est.)
19 % of GDP
$63.36 billion
Economic Overview
natural resource-rich Eurasian economy; leading energy exporter to Europe and Asia; decreased oil export reliance; endemic corruption, Ukrainian invasion, and lack of green infrastructure limit investment and have led to sanctions
All Economic Data
Agricultural products
wheat, sugar beets, milk, barley, potatoes, sunflower seeds, maize, soybeans, chicken, pork (2023)
note:
<b>note:</b> top ten agricultural products based on tonnage
Average household expenditures
On alcohol and tobacco:
5.9% of household expenditures (2023 est.)
On food:
25.3% of household expenditures (2023 est.)
Budget
Expenditures:
$635.809 billion (2023 est.)
Note:
<b>note:</b> central government revenues (excluding grants) and expenditures converted to US dollars at average official exchange rate for year indicated
Revenues:
$704.613 billion (2023 est.)
Currency
code:
RUB
name:
Russian ruble (RUB) [₽]
Current account balance
$63.36 billion
Current account balance 2022:
$237.735 billion (2022 est.)
Current account balance 2023:
$49.439 billion (2023 est.)
Current account balance 2024:
$62.287 billion (2024 est.)
Note:
<b>note:</b> balance of payments - net trade and primary/secondary income in current dollars
Debt - external
$376.12 billion
Debt - external 2022:
$135.301 billion (2022 est.)
Note:
<b>note:</b> present value of external debt in current US dollars
Exchange rates
Currency:
Russian rubles (RUB) per US dollar -
Exchange rates 2019:
64.738 (2019 est.)
Exchange rates 2020:
72.105 (2020 est.)
Exchange rates 2021:
73.654 (2021 est.)
Exchange rates 2022:
68.485 (2022 est.)
Exchange rates 2023:
85.162 (2023 est.)
Exports
$476.43 billion
Exports 2022:
$640.878 billion (2022 est.)
Exports 2023:
$465.22 billion (2023 est.)
Exports 2024:
$475.277 billion (2024 est.)
Note:
<b>note:</b> balance of payments - exports of goods and services in current dollars
Exports - commodities
crude petroleum, refined petroleum, natural gas, coal, fertilizers (2023)
note:
<b>note:</b> top five export commodities based on value in dollars
Exports - partners
China 33%, India 17%, Turkey 8%, Kazakhstan 4%, Brazil 3% (2023)
note:
<b>note:</b> top five export partners based on percentage share of exports
Foreign direct investment
net inflows:
$-9,350,250,000
GDP - composition, by end use
Exports of goods and services:
21.9% (2024 est.)
Government consumption:
18.6% (2024 est.)
Household consumption:
49.4% (2024 est.)
Imports of goods and services:
-17.6% (2024 est.)
Investment in fixed capital:
22.1% (2024 est.)
Investment in inventories:
4.2% (2024 est.)
Note:
<b>note:</b> figures may not total 100% due to rounding or gaps in data collection
GDP - composition, by sector of origin
Agriculture:
2.7% (2024 est.)
Industry:
30.7% (2024 est.)
Note:
<b>note:</b> figures may not total 100% due to non-allocated consumption not captured in sector-reported data
Services:
57.5% (2024 est.)
GDP (official exchange rate)
$2.174 trillion (2024 est.)
note:
<b>note:</b> data in current dollars at official exchange rate
GDP per capita (nominal)
$14,889
Gini Index coefficient - distribution of family income
37.5 (2018)
Gini Index coefficient - distribution of family income 2021:
35.1 (2021 est.)
Note:
<b>note:</b> index (0-100) of income distribution; higher values represent greater inequality
GNI (gross national income)
$2.15 trillion
GNI per capita
$15,320
Gross domestic investment
26 % of GDP
Household income or consumption by percentage share
Highest 10%:
26.6% (2021 est.)
Lowest 10%:
2.7% (2021 est.)
Note:
<b>note:</b> % share of income accruing to lowest and highest 10% of population
Imports
$382.41 billion
Imports 2022:
$347.384 billion (2022 est.)
Imports 2023:
$379.659 billion (2023 est.)
Imports 2024:
$381.45 billion (2024 est.)
Note:
<b>note:</b> balance of payments - imports of goods and services in current dollars
Imports - commodities
cars, packaged medicine, broadcasting equipment, garments, plastic products (2023)
note:
<b>note:</b> top five import commodities based on value in dollars
Imports - partners
China 53%, Turkey 5%, Germany 5%, Kazakhstan 5%, Italy 2% (2023)
note:
<b>note:</b> top five import partners based on percentage share of imports
Industrial production growth rate
4.1% (2024 est.)
note:
<b>note:</b> annual % change in industrial value added based on constant local currency
Industries
complete range of mining and extractive industries producing coal, oil, gas, chemicals, and metals; all forms of machine building from rolling mills to high-performance aircraft and space vehicles; defense industries (including radar, missile production, advanced electronic components), shipbuilding; road and rail transportation equipment; communications equipment; agricultural machinery, tractors, and construction equipment; electric power generating and transmitting equipment; medical and scie
Inflation rate (consumer prices)
8.43%
Inflation rate (consumer prices) 2019:
4.5% (2019 est.)
Inflation rate (consumer prices) 2020:
3.4% (2020 est.)
Inflation rate (consumer prices) 2021:
6.7% (2021 est.)
Note:
<b>note:</b> annual % change based on consumer prices
Labor force
72.517 million (2024 est.)
note:
<b>note:</b> number of people ages 15 or older who are employed or seeking work
total:
72.39 million persons
Labor force - by occupation
agriculture:
5.11%
industry:
25.83%
services:
69.06%
Population below poverty line
12.1% (2020 est.)
note:
<b>note:</b> % of population with income below national poverty line
Public debt
19 % of GDP
Note:
<b>note:</b> central government debt as a % of GDP
Public debt 2023:
18.5% of GDP (2023 est.)
Real GDP (purchasing power parity)
$6.92 trillion
Note:
<b>note:</b> data in 2021 dollars
Real GDP (purchasing power parity) 2022:
$5.607 trillion (2022 est.)
Real GDP (purchasing power parity) 2023:
$5.835 trillion (2023 est.)
Real GDP (purchasing power parity) 2024:
$6.089 trillion (2024 est.)
Real GDP growth rate
4.34%
Note:
<b>note:</b> annual GDP % growth based on constant local currency
Real GDP growth rate 2022:
-1.4% (2022 est.)
Real GDP growth rate 2023:
4.1% (2023 est.)
Real GDP growth rate 2024:
4.3% (2024 est.)
Real GDP per capita
$47,405
Note:
<b>note:</b> data in 2021 dollars
Real GDP per capita 2022:
$38,200 (2022 est.)
Real GDP per capita 2023:
$39,900 (2023 est.)
Real GDP per capita 2024:
$41,700 (2024 est.)
Remittances
$1.91 billion
Note:
<b>note:</b> personal transfers and compensation between resident and non-resident individuals/households/entities
Remittances 2022:
0.1% of GDP (2022 est.)
Remittances 2023:
0.1% of GDP (2023 est.)
Remittances 2024:
0.1% of GDP (2024 est.)
Reserves of foreign exchange and gold
$597.22 billion
Note:
<b>note:</b> holdings of gold (year-end prices)/foreign exchange/special drawing rights in current dollars
Reserves of foreign exchange and gold 2021:
$632.242 billion (2021 est.)
Reserves of foreign exchange and gold 2022:
$581.71 billion (2022 est.)
Reserves of foreign exchange and gold 2023:
$597.217 billion (2023 est.)
Revenue (excl grants)
29 % of GDP
Tax revenue
12 % of GDP
Taxes and other revenues
12.1% (of GDP) (2023 est.)
note:
<b>note:</b> central government tax revenue as a % of GDP
Unemployment rate
2.13%
Note:
<b>note:</b> % of labor force seeking employment
Unemployment rate 2022:
3.9% (2022 est.)
Unemployment rate 2023:
3.1% (2023 est.)
Unemployment rate 2024:
2.6% (2024 est.)
Youth unemployment rate (ages 15-24)
Female:
9.8% (2024 est.)
Male:
8.8% (2024 est.)
Note:
<b>note:</b> % of labor force ages 15-24 seeking employment
Total:
9.3% (2024 est.)
World Bank Indicators
Currency
Serbian dinar (RSD) . (2025)
Gini Index
36.20 (2017)
Languages
Serbian (2025)
Economic Rankings
GDP (PPP)
#4
Reserves
#6
External Debt
#7
GDP (Nominal)
#11
Exports
#17
Imports
#24
GDP per Capita
#48
Gini Index
#84
Inflation Rate
#98
GDP Growth Rate
#114
Unemployment Rate
#127
Quick Facts
Industries
complete range of mining and extractive industries producing coal, oil, gas, chemicals, and metals; all forms of machine building from rolling mills to high-performance aircraft and space vehicles; de
Agricultural products
wheat, sugar beets, milk, barley, potatoes, sunflower seeds, maize, soybeans, chicken, pork (2023)
Labor force
72.517 million (2024 est.)
Exports - partners
China 33%, India 17%, Turkey 8%, Kazakhstan 4%, Brazil 3% (2023)
Imports - partners
China 53%, Turkey 5%, Germany 5%, Kazakhstan 5%, Italy 2% (2023)
Exchange rates
Russian rubles (RUB) per US dollar -
Explore More
Our Partners
Trusted partner applications powering global data and insights