Countries
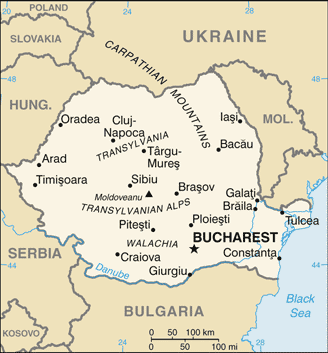
Romania

Key Economic Indicators
$935 billion
$49,077
0.92%
5.72%
5.99%
$382.768 billion (2024 est.)
<b>note:</b> central government debt as a % of GDP
$-31,207,506,064
Economic Overview
<p>high-income, EU-member economy; euro membership delayed over macroeconomic indicators; persistent inflation, but consumption and EU-funded investments driving recovery; skilled labor shortage; high public debt and budget deficit; challenges include fiscal sustainability and political instability</p>
All Economic Data
Agricultural products
wheat, maize, milk, sunflower seeds, barley, rapeseed, potatoes, grapes, plums, apples (2023)
note:
<b>note:</b> top ten agricultural products based on tonnage
Average household expenditures
On alcohol and tobacco:
6.1% of household expenditures (2023 est.)
On food:
25.1% of household expenditures (2023 est.)
Budget
Expenditures:
$112.799 billion (2022 est.)
Note:
<b>note:</b> central government revenues (excluding grants) and expenditures converted to US dollars at average official exchange rate for year indicated
Revenues:
$93.691 billion (2022 est.)
Currency
code:
RON
name:
Romanian leu (RON) [lei]
Current account balance
$-31,207,506,064
Current account balance 2022:
-$27.326 billion (2022 est.)
Current account balance 2023:
-$24.461 billion (2023 est.)
Current account balance 2024:
-$31.988 billion (2024 est.)
Note:
<b>note:</b> balance of payments - net trade and primary/secondary income in current dollars
Exchange rates
Currency:
lei (RON) per US dollar -
Exchange rates 2020:
4.244 (2020 est.)
Exchange rates 2021:
4.16 (2021 est.)
Exchange rates 2022:
4.688 (2022 est.)
Exchange rates 2023:
4.574 (2023 est.)
Exchange rates 2024:
4.598 (2024 est.)
Exports
$136.2 billion
Exports 2022:
$129.286 billion (2022 est.)
Exports 2023:
$136.488 billion (2023 est.)
Exports 2024:
$136.253 billion (2024 est.)
Note:
<b>note:</b> balance of payments - exports of goods and services in current dollars
Exports - commodities
cars, vehicle parts/accessories, insulated wire, garments, wheat (2023)
note:
<b>note:</b> top five export commodities based on value in dollars
Exports - partners
Germany 19%, Italy 10%, France 6%, UK 5%, Hungary 4% (2023)
note:
<b>note:</b> top five export partners based on percentage share of exports
Foreign direct investment
net inflows:
$7.16 billion
GDP - composition, by end use
Exports of goods and services:
35.6% (2024 est.)
Government consumption:
18.3% (2024 est.)
Household consumption:
63.5% (2024 est.)
Imports of goods and services:
-41.7% (2024 est.)
Investment in fixed capital:
25.7% (2024 est.)
Investment in inventories:
-1.4% (2024 est.)
Note:
<b>note:</b> figures may not total 100% due to rounding or gaps in data collection
GDP - composition, by sector of origin
Agriculture:
3.3% (2024 est.)
Industry:
25% (2024 est.)
Note:
<b>note:</b> figures may not total 100% due to non-allocated consumption not captured in sector-reported data
Services:
62.5% (2024 est.)
GDP (official exchange rate)
$382.768 billion (2024 est.)
note:
<b>note:</b> data in current dollars at official exchange rate
GDP per capita (nominal)
$20,080
Gini Index coefficient - distribution of family income
35.8 (2018)
Gini Index coefficient - distribution of family income 2022:
32.3 (2022 est.)
Note:
<b>note:</b> index (0-100) of income distribution; higher values represent greater inequality
GNI (gross national income)
$373.57 billion
GNI per capita
$17,600
Gross domestic investment
25 % of GDP
Household income or consumption by percentage share
Highest 10%:
22.6% (2022 est.)
Lowest 10%:
1.9% (2022 est.)
Note:
<b>note:</b> % share of income accruing to lowest and highest 10% of population
Imports
$159.19 billion
Imports 2022:
$149.209 billion (2022 est.)
Imports 2023:
$153.427 billion (2023 est.)
Imports 2024:
$159.575 billion (2024 est.)
Note:
<b>note:</b> balance of payments - imports of goods and services in current dollars
Imports - commodities
vehicle parts/accessories, packaged medicine, cars, crude petroleum, plastic products (2023)
note:
<b>note:</b> top five import commodities based on value in dollars
Imports - partners
Germany 19%, Italy 8%, Hungary 6%, Poland 6%, China 6% (2023)
note:
<b>note:</b> top five import partners based on percentage share of imports
Industrial production growth rate
-0.9% (2024 est.)
note:
<b>note:</b> annual % change in industrial value added based on constant local currency
Industries
electric machinery and equipment, auto assembly, textiles and footwear, light machinery, metallurgy, chemicals, food processing, petroleum refining, mining, timber, construction materials
Inflation rate (consumer prices)
5.72%
Inflation rate (consumer prices) 2022:
13.8% (2022 est.)
Inflation rate (consumer prices) 2023:
10.4% (2023 est.)
Inflation rate (consumer prices) 2024:
5.7% (2024 est.)
Note:
<b>note:</b> annual % change based on consumer prices
Labor force
8.263 million (2024 est.)
note:
<b>note:</b> number of people ages 15 or older who are employed or seeking work
total:
8.21 million persons
Labor force - by occupation
agriculture:
10.95%
industry:
32.57%
services:
56.48%
Population below poverty line
21.1% (2022 est.)
note:
<b>note:</b> % of population with income below national poverty line
Public debt
Note:
<b>note:</b> central government debt as a % of GDP
Public debt 2022:
50.9% of GDP (2022 est.)
Real GDP (purchasing power parity)
$935 billion
Note:
<b>note:</b> data in 2021 dollars
Real GDP (purchasing power parity) 2022:
$750.091 billion (2022 est.)
Real GDP (purchasing power parity) 2023:
$768.126 billion (2023 est.)
Real GDP (purchasing power parity) 2024:
$774.376 billion (2024 est.)
Real GDP growth rate
0.92%
Note:
<b>note:</b> annual GDP % growth based on constant local currency
Real GDP growth rate 2022:
4% (2022 est.)
Real GDP growth rate 2023:
2.4% (2023 est.)
Real GDP growth rate 2024:
0.8% (2024 est.)
Real GDP per capita
$49,077
Note:
<b>note:</b> data in 2021 dollars
Real GDP per capita 2022:
$39,400 (2022 est.)
Real GDP per capita 2023:
$40,300 (2023 est.)
Real GDP per capita 2024:
$40,600 (2024 est.)
Remittances
$9.53 billion
Note:
<b>note:</b> personal transfers and compensation between resident and non-resident individuals/households/entities
Remittances 2022:
3% of GDP (2022 est.)
Remittances 2023:
2.8% of GDP (2023 est.)
Remittances 2024:
2.5% of GDP (2024 est.)
Reserves of foreign exchange and gold
$73.39 billion
Note:
<b>note:</b> holdings of gold (year-end prices)/foreign exchange/special drawing rights in current dollars
Reserves of foreign exchange and gold 2022:
$55.81 billion (2022 est.)
Reserves of foreign exchange and gold 2023:
$73 billion (2023 est.)
Reserves of foreign exchange and gold 2024:
$73.391 billion (2024 est.)
Revenue (excl grants)
32 % of GDP
Tax revenue
16 % of GDP
Taxes and other revenues
16.2% (of GDP) (2022 est.)
note:
<b>note:</b> central government tax revenue as a % of GDP
Unemployment rate
5.99%
Note:
<b>note:</b> % of labor force seeking employment
Unemployment rate 2022:
5.7% (2022 est.)
Unemployment rate 2023:
5.6% (2023 est.)
Unemployment rate 2024:
5.4% (2024 est.)
Youth unemployment rate (ages 15-24)
Female:
21.8% (2024 est.)
Male:
21.1% (2024 est.)
Note:
<b>note:</b> % of labor force ages 15-24 seeking employment
Total:
21.3% (2024 est.)
World Bank Indicators
Currency
Romanian leu (RON) lei (2025)
Gini Index
35.80 (2018)
Languages
Romanian (2025)
Economic Rankings
GDP (PPP)
#34
Reserves
#35
Imports
#37
Exports
#39
GDP (Nominal)
#41
GDP per Capita
#45
Inflation Rate
#49
Unemployment Rate
#83
Gini Index
#100
GDP Growth Rate
#133
Quick Facts
Industries
electric machinery and equipment, auto assembly, textiles and footwear, light machinery, metallurgy, chemicals, food processing, petroleum refining, mining, timber, construction materials
Agricultural products
wheat, maize, milk, sunflower seeds, barley, rapeseed, potatoes, grapes, plums, apples (2023)
Labor force
8.263 million (2024 est.)
Exports - partners
Germany 19%, Italy 10%, France 6%, UK 5%, Hungary 4% (2023)
Imports - partners
Germany 19%, Italy 8%, Hungary 6%, Poland 6%, China 6% (2023)
Exchange rates
lei (RON) per US dollar -
Explore More
Our Partners
Trusted partner applications powering global data and insights