Countries
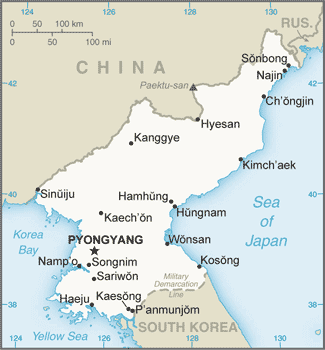
North Korea

Key Economic Indicators
<strong>note:</strong> data in 2015 dollars
<strong>note:</strong> data in 2015 dollars
3.55%
$16.447 billion (2023 est.)
Economic Overview
one of the last centrally planned economies; hard hit by COVID-19, crop failures, international sanctions, and isolationist policies; declining growth and trade, and heavily reliant on China; poor exchange rate stability; economic data integrity issues
All Economic Data
Agricultural products
maize, vegetables, rice, apples, cabbages, fruits, sweet potatoes, potatoes, beans, soybeans (2023)
note:
<b>note:</b> top ten agricultural products based on tonnage
Currency
code:
KPW
name:
North Korean won (KPW) [₩]
Exchange rates
Currency:
North Korean won (KPW) per US dollar (average market rate)
Exchange rates 2015:
130 (2015 est.)
Exchange rates 2016:
130 (2016 est.)
Exchange rates 2017:
135 (2017 est.)
Exports - commodities
fake hair, iron alloys, tungsten ore, electricity, cars (2023)
note:
<b>note:</b> top five export commodities based on value in dollars
Exports - partners
China 74%, Poland 3%, Senegal 3%, Angola 3%, Austria 3% (2023)
note:
<b>note:</b> top five export partners based on percentage share of exports
GDP (official exchange rate)
$16.447 billion (2023 est.)
note:
<strong>note:</strong> data in current dollars at official exchange rate
Imports - commodities
processed hair, plastic products, garments, fabric, soybean oil (2023)
note:
<b>note:</b> top five import commodities based on value in dollars
Imports - partners
China 97%, Togo 1%, Peru 1%, Gabon 1%, India 0% (2023)
note:
<b>note:</b> top five import partners based on percentage share of imports
Industries
military products; machine building, electric power, chemicals; mining (coal, iron ore, limestone, magnesite, graphite, copper, zinc, lead, and precious metals), metallurgy; textiles, food processing; tourism
Labor force
17.637 million (2024 est.)
note:
<b>note:</b> number of people ages 15 or older who are employed or seeking work
total:
17.7 million persons
Labor force - by occupation
agriculture:
54.08%
industry:
22.41%
services:
23.51%
Real GDP (purchasing power parity)
Note:
<strong>note:</strong> data in 2015 dollars
Real GDP (purchasing power parity) 2021:
$14.982 billion (2021 est.)
Real GDP (purchasing power parity) 2022:
$14.959 billion (2022 est.)
Real GDP (purchasing power parity) 2023:
$15.416 billion (2023 est.)
Real GDP per capita
Note:
<strong>note:</strong> data in 2015 dollars
Real GDP per capita 2021:
$600 (2021 est.)
Real GDP per capita 2022:
$600 (2022 est.)
Real GDP per capita 2023:
$600 (2023 est.)
Unemployment rate
3.55%
Note:
<b>note:</b> % of labor force seeking employment
Unemployment rate 2022:
2.9% (2022 est.)
Unemployment rate 2023:
2.9% (2023 est.)
Unemployment rate 2024:
2.9% (2024 est.)
Youth unemployment rate (ages 15-24)
Female:
7.4% (2024 est.)
Male:
6.1% (2024 est.)
Note:
<b>note:</b> % of labor force ages 15-24 seeking employment
Total:
6.8% (2024 est.)
World Bank Indicators
Currency
Eastern Caribbean dollar (XCD) $ (2025)
Languages
English (2025)
Economic Rankings
Unemployment Rate
#137
GDP (Nominal)
#137
GDP (PPP)
#155
GDP per Capita
#194
Quick Facts
Industries
military products; machine building, electric power, chemicals; mining (coal, iron ore, limestone, magnesite, graphite, copper, zinc, lead, and precious metals), metallurgy; textiles, food processing;
Agricultural products
maize, vegetables, rice, apples, cabbages, fruits, sweet potatoes, potatoes, beans, soybeans (2023)
Labor force
17.637 million (2024 est.)
Exports - partners
China 74%, Poland 3%, Senegal 3%, Angola 3%, Austria 3% (2023)
Imports - partners
China 97%, Togo 1%, Peru 1%, Gabon 1%, India 0% (2023)
Exchange rates
North Korean won (KPW) per US dollar (average market rate)
Explore More
Our Partners
Trusted partner applications powering global data and insights