Countries
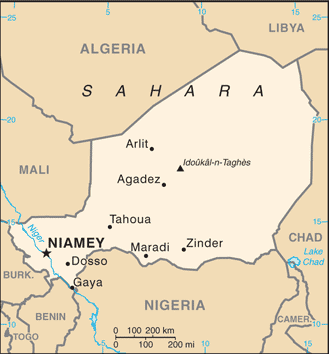
Niger

Key Economic Indicators
$55.41 billion
$2,050
10.3%
9.07%
0.39%
$19.538 billion (2024 est.)
45.2% of GDP (2016 est.)
$-2,332,754,444
Economic Overview
low-income Sahel economy; major instability and humanitarian crises limit economic activity; COVID-19 eliminated recent antipoverty gains; economy rebounding since December 2020 Nigerian border reopening and new investments; uranium resource rich
All Economic Data
Agricultural products
millet, cowpeas, sorghum, onions, milk, sugarcane, cabbages, cassava, groundnuts, tomatoes (2023)
note:
<b>note:</b> top ten agricultural products based on tonnage
Budget
Expenditures:
$2.785 billion (2019 est.)
Revenues:
$2.325 billion (2019 est.)
Currency
code:
XOF
name:
West African CFA franc (XOF) [Fr]
Current account balance
$-2,332,754,444
Current account balance 2021:
-$2.099 billion (2021 est.)
Current account balance 2022:
-$2.5 billion (2022 est.)
Current account balance 2023:
-$2.333 billion (2023 est.)
Note:
<b>note:</b> balance of payments - net trade and primary/secondary income in current dollars
Debt - external
$5.31 billion
Debt - external 2023:
$3.793 billion (2023 est.)
Note:
<b>note:</b> present value of external debt in current US dollars
Exchange rates
Currency:
Communaute Financiere Africaine francs (XOF) per US dollar -
Exchange rates 2020:
575.586 (2020 est.)
Exchange rates 2021:
554.531 (2021 est.)
Exchange rates 2022:
623.76 (2022 est.)
Exchange rates 2023:
606.57 (2023 est.)
Exchange rates 2024:
606.345 (2024 est.)
Exports
$5.43 billion
Exports 2021:
$1.487 billion (2021 est.)
Exports 2022:
$1.376 billion (2022 est.)
Exports 2023:
$1.223 billion (2023 est.)
Note:
<b>note:</b> balance of payments - exports of goods and services in current dollars
Exports - commodities
gold, oil seeds, uranium and thorium ore, radioactive chemicals, refined petroleum (2023)
note:
<b>note:</b> top five export commodities based on value in dollars
Exports - partners
UAE 31%, France 23%, China 18%, India 6%, Sweden 5% (2023)
note:
<b>note:</b> top five export partners based on percentage share of exports
Foreign direct investment
net inflows:
$358.08 million
GDP - composition, by end use
Exports of goods and services:
31.2% (2024 est.)
Government consumption:
11.8% (2024 est.)
Household consumption:
59.2% (2024 est.)
Imports of goods and services:
-20.8% (2024 est.)
Investment in fixed capital:
18.7% (2024 est.)
Investment in inventories:
0% (2024 est.)
Note:
<strong>note:</strong> figures may not total 100% due to rounding or gaps in data collection
GDP - composition, by sector of origin
Agriculture:
33.8% (2024 est.)
Industry:
17.8% (2024 est.)
Note:
<b>note:</b> figures may not total 100% due to non-allocated consumption not captured in sector-reported data
Services:
45.4% (2024 est.)
GDP (official exchange rate)
$19.538 billion (2024 est.)
note:
<b>note:</b> data in current dollars at official exchange rate
GDP per capita (nominal)
$735
Gini Index coefficient - distribution of family income
34.3 (2014)
Gini Index coefficient - distribution of family income 2021:
32.9 (2021 est.)
Note:
<b>note:</b> index (0-100) of income distribution; higher values represent greater inequality
GNI (gross national income)
$19.64 billion
GNI per capita
$680
Gross domestic investment
22 % of GDP
Household income or consumption by percentage share
Highest 10%:
27.8% (2021 est.)
Lowest 10%:
3.8% (2021 est.)
Note:
<b>note:</b> % share of income accruing to lowest and highest 10% of population
Imports
$4.5 billion
Imports 2021:
$4.027 billion (2021 est.)
Imports 2022:
$4.194 billion (2022 est.)
Imports 2023:
$3.808 billion (2023 est.)
Note:
<b>note:</b> balance of payments - imports of goods and services in current dollars
Imports - commodities
rice, aircraft parts, iron structures, refined petroleum, centrifuges (2023)
note:
<b>note:</b> top five import commodities based on value in dollars
Imports - partners
China 26%, France 15%, India 12%, Nigeria 7%, UAE 6% (2023)
note:
<b>note:</b> top five import partners based on percentage share of imports
Industrial production growth rate
12.1% (2024 est.)
note:
<b>note:</b> annual % change in industrial value added based on constant local currency
Industries
uranium mining, petroleum, cement, brick, soap, textiles, food processing, chemicals, slaughterhouses
Inflation rate (consumer prices)
9.07%
Inflation rate (consumer prices) 2022:
4.2% (2022 est.)
Inflation rate (consumer prices) 2023:
3.7% (2023 est.)
Inflation rate (consumer prices) 2024:
9.1% (2024 est.)
Note:
<b>note:</b> annual % change based on consumer prices
Labor force
10.486 million (2024 est.)
note:
<b>note:</b> number of people ages 15 or older who are employed or seeking work
total:
11.97 million persons
Labor force - by occupation
agriculture:
72.99%
industry:
9.27%
services:
17.74%
Population below poverty line
45.5% (2021 est.)
note:
<b>note:</b> % of population with income below national poverty line
Public debt
Public debt 2016:
45.2% of GDP (2016 est.)
Real GDP (purchasing power parity)
$55.41 billion
Note:
<b>note:</b> data in 2021 dollars
Real GDP (purchasing power parity) 2022:
$43.474 billion (2022 est.)
Real GDP (purchasing power parity) 2023:
$44.199 billion (2023 est.)
Real GDP (purchasing power parity) 2024:
$47.921 billion (2024 est.)
Real GDP growth rate
10.3%
Note:
<b>note:</b> annual GDP % growth based on constant local currency
Real GDP growth rate 2022:
11.9% (2022 est.)
Real GDP growth rate 2023:
1.7% (2023 est.)
Real GDP growth rate 2024:
8.4% (2024 est.)
Real GDP per capita
$2,050
Note:
<b>note:</b> data in 2021 dollars
Real GDP per capita 2022:
$1,700 (2022 est.)
Real GDP per capita 2023:
$1,700 (2023 est.)
Real GDP per capita 2024:
$1,800 (2024 est.)
Remittances
$650.39 million
Note:
<b>note:</b> personal transfers and compensation between resident and non-resident individuals/households/entities
Remittances 2021:
2.4% of GDP (2021 est.)
Remittances 2022:
4.7% of GDP (2022 est.)
Remittances 2023:
3.7% of GDP (2023 est.)
Unemployment rate
0.39%
Note:
<b>note:</b> % of labor force seeking employment
Unemployment rate 2022:
0.5% (2022 est.)
Unemployment rate 2023:
0.5% (2023 est.)
Unemployment rate 2024:
0.4% (2024 est.)
Youth unemployment rate (ages 15-24)
Female:
0.2% (2024 est.)
Male:
0.4% (2024 est.)
Note:
<b>note:</b> % of labor force ages 15-24 seeking employment
Total:
0.3% (2024 est.)
World Bank Indicators
Currency
Nigerian naira (NGN) (2025)
Gini Index
35.10 (2018)
Languages
English (2025)
Economic Rankings
GDP Growth Rate
#13
External Debt
#83
Inflation Rate
#88
Gini Index
#118
GDP (PPP)
#127
GDP (Nominal)
#129
Exports
#139
Imports
#151
Unemployment Rate
#177
GDP per Capita
#182
Quick Facts
Industries
uranium mining, petroleum, cement, brick, soap, textiles, food processing, chemicals, slaughterhouses
Agricultural products
millet, cowpeas, sorghum, onions, milk, sugarcane, cabbages, cassava, groundnuts, tomatoes (2023)
Labor force
10.486 million (2024 est.)
Exports - partners
UAE 31%, France 23%, China 18%, India 6%, Sweden 5% (2023)
Imports - partners
China 26%, France 15%, India 12%, Nigeria 7%, UAE 6% (2023)
Exchange rates
Communaute Financiere Africaine francs (XOF) per US dollar -
Explore More
Our Partners
Trusted partner applications powering global data and insights