Countries
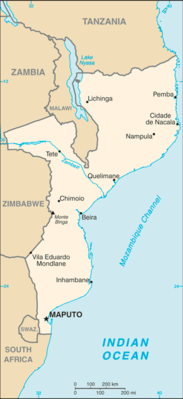
Mozambique

Key Economic Indicators
$59.06 billion
$1,705
2.15%
4.08%
6.63%
$22.417 billion (2024 est.)
72 % of GDP
$-2,493,130,139
Economic Overview
low-income East African economy; subsistence farming dominates labor force; return to growth led by agriculture and extractive industries; Islamist insurgency threatens natural gas projects in north; ongoing foreign debt restructuring and resolution under IMF Highly Indebted Poor Countries (HIPC) initiative
All Economic Data
Agricultural products
cassava, maize, sugarcane, tomatoes, beans, potatoes, sweet potatoes, bananas, coconuts, onions (2023)
note:
<b>note:</b> top ten agricultural products based on tonnage
Budget
Expenditures:
$7.223 billion (2024 est.)
Note:
<b>note:</b> central government revenues and expenses (excluding grants/extrabudgetary units/social security funds) converted to US dollars at average official exchange rate for year indicated
Revenues:
$6.243 billion (2024 est.)
Currency
code:
MZN
name:
Mozambican metical (MZN) [MT]
Current account balance
$-2,493,130,139
Current account balance 2022:
-$6.367 billion (2022 est.)
Current account balance 2023:
-$2.207 billion (2023 est.)
Current account balance 2024:
-$2.498 billion (2024 est.)
Note:
<b>note:</b> balance of payments - net trade and primary/secondary income in current dollars
Debt - external
$69.77 billion
Debt - external 2023:
$8.274 billion (2023 est.)
Note:
<strong>note:</strong> present value of external debt in current US dollars
Exchange rates
Currency:
meticais (MZM) per US dollar -
Exchange rates 2020:
69.465 (2020 est.)
Exchange rates 2021:
65.465 (2021 est.)
Exchange rates 2022:
63.851 (2022 est.)
Exchange rates 2023:
63.886 (2023 est.)
Exchange rates 2024:
63.905 (2024 est.)
Exports
$9.74 billion
Exports 2022:
$9.409 billion (2022 est.)
Exports 2023:
$9.405 billion (2023 est.)
Exports 2024:
$9.358 billion (2024 est.)
Note:
<b>note:</b> balance of payments - exports of goods and services in current dollars
Exports - commodities
coal, natural gas, aluminum, gold, precious stones (2023)
note:
<b>note:</b> top five export commodities based on value in dollars
Exports - partners
India 18%, China 13%, South Africa 9%, UAE 6%, Thailand 4% (2023)
note:
<b>note:</b> top five export partners based on percentage share of exports
Foreign direct investment
net inflows:
$3.51 billion
GDP - composition, by end use
Exports of goods and services:
42.7% (2024 est.)
Government consumption:
17.1% (2024 est.)
Household consumption:
69% (2024 est.)
Imports of goods and services:
-52.9% (2024 est.)
Investment in fixed capital:
24.1% (2024 est.)
Investment in inventories:
0% (2024 est.)
Note:
<strong>note:</strong> figures may not total 100% due to rounding or gaps in data collection
GDP - composition, by sector of origin
Agriculture:
26.3% (2024 est.)
Industry:
24.6% (2024 est.)
Note:
<b>note:</b> figures may not total 100% due to non-allocated consumption not captured in sector-reported data
Services:
38.4% (2024 est.)
GDP (official exchange rate)
$22.417 billion (2024 est.)
note:
<b>note:</b> data in current dollars at official exchange rate
GDP per capita (nominal)
$657
Gini Index coefficient - distribution of family income
54 (2014)
Gini Index coefficient - distribution of family income 2019:
50.3 (2019 est.)
Note:
<b>note:</b> index (0-100) of income distribution; higher values represent greater inequality
GNI (gross national income)
$20.23 billion
GNI per capita
$550
Gross domestic investment
18 % of GDP
Household income or consumption by percentage share
Highest 10%:
41.1% (2019 est.)
Lowest 10%:
1.7% (2019 est.)
Note:
<b>note:</b> % share of income accruing to lowest and highest 10% of population
Imports
$12.02 billion
Imports 2022:
$15.932 billion (2022 est.)
Imports 2023:
$11.18 billion (2023 est.)
Imports 2024:
$10.488 billion (2024 est.)
Note:
<b>note:</b> balance of payments - imports of goods and services in current dollars
Imports - commodities
refined petroleum, chromium ore, iron alloys, iron ore, palm oil (2023)
note:
<b>note:</b> top five import commodities based on value in dollars
Imports - partners
South Africa 34%, China 14%, India 13%, UAE 6%, Singapore 3% (2023)
note:
<b>note:</b> top five import partners based on percentage share of imports
Industrial production growth rate
2.9% (2024 est.)
note:
<b>note:</b> annual % change in industrial value added based on constant local currency
Industries
aluminum, petroleum products, chemicals (fertilizer, soap, paints), textiles, cement, glass, asbestos, tobacco, food, beverages
Inflation rate (consumer prices)
4.08%
Inflation rate (consumer prices) 2022:
10.3% (2022 est.)
Inflation rate (consumer prices) 2023:
7.1% (2023 est.)
Inflation rate (consumer prices) 2024:
4.1% (2024 est.)
Note:
<b>note:</b> annual % change based on consumer prices
Labor force
15.173 million (2024 est.)
note:
<b>note:</b> number of people ages 15 or older who are employed or seeking work
total:
15.66 million persons
Labor force - by occupation
agriculture:
73.01%
industry:
6.44%
services:
20.55%
Population below poverty line
62.8% (2019 est.)
note:
<b>note:</b> % of population with income below national poverty line
Public debt
72 % of GDP
Note:
<b>note:</b> central government debt as a % of GDP
Public debt 2022:
76.6% of GDP (2022 est.)
Real GDP (purchasing power parity)
$59.06 billion
Note:
<b>note:</b> data in 2021 dollars
Real GDP (purchasing power parity) 2022:
$48.222 billion (2022 est.)
Real GDP (purchasing power parity) 2023:
$50.844 billion (2023 est.)
Real GDP (purchasing power parity) 2024:
$51.786 billion (2024 est.)
Real GDP growth rate
2.15%
Note:
<b>note:</b> annual GDP % growth based on constant local currency
Real GDP growth rate 2022:
4.4% (2022 est.)
Real GDP growth rate 2023:
5.4% (2023 est.)
Real GDP growth rate 2024:
1.9% (2024 est.)
Real GDP per capita
$1,705
Note:
<b>note:</b> data in 2021 dollars
Real GDP per capita 2022:
$1,500 (2022 est.)
Real GDP per capita 2023:
$1,500 (2023 est.)
Real GDP per capita 2024:
$1,500 (2024 est.)
Remittances
$266.91 million
Note:
<b>note:</b> personal transfers and compensation between resident and non-resident individuals/households/entities
Remittances 2022:
0.9% of GDP (2022 est.)
Remittances 2023:
1.2% of GDP (2023 est.)
Remittances 2024:
1.2% of GDP (2024 est.)
Reserves of foreign exchange and gold
$3.84 billion
Note:
<b>note:</b> holdings of gold (year-end prices)/foreign exchange/special drawing rights in current dollars
Reserves of foreign exchange and gold 2022:
$2.939 billion (2022 est.)
Reserves of foreign exchange and gold 2023:
$3.637 billion (2023 est.)
Reserves of foreign exchange and gold 2024:
$3.843 billion (2024 est.)
Revenue (excl grants)
25 % of GDP
Tax revenue
22 % of GDP
Taxes and other revenues
22.7% (of GDP) (2022 est.)
note:
<b>note:</b> central government tax revenue as a % of GDP
Unemployment rate
6.63%
Note:
<b>note:</b> % of labor force seeking employment
Unemployment rate 2022:
3.6% (2022 est.)
Unemployment rate 2023:
3.6% (2023 est.)
Unemployment rate 2024:
3.6% (2024 est.)
Youth unemployment rate (ages 15-24)
Female:
7.2% (2024 est.)
Male:
7.5% (2024 est.)
Note:
<b>note:</b> % of labor force ages 15-24 seeking employment
Total:
7.4% (2024 est.)
World Bank Indicators
Currency
Mozambican metical (MZN) MT (2025)
Gini Index
54.00 (2014)
Languages
Portuguese (2025)
Economic Rankings
Gini Index
#9
External Debt
#22
Inflation Rate
#70
Unemployment Rate
#72
GDP Growth Rate
#78
Imports
#104
Reserves
#110
Exports
#117
GDP (Nominal)
#121
GDP (PPP)
#123
GDP per Capita
#187
Quick Facts
Industries
aluminum, petroleum products, chemicals (fertilizer, soap, paints), textiles, cement, glass, asbestos, tobacco, food, beverages
Agricultural products
cassava, maize, sugarcane, tomatoes, beans, potatoes, sweet potatoes, bananas, coconuts, onions (2023)
Labor force
15.173 million (2024 est.)
Exports - partners
India 18%, China 13%, South Africa 9%, UAE 6%, Thailand 4% (2023)
Imports - partners
South Africa 34%, China 14%, India 13%, UAE 6%, Singapore 3% (2023)
Exchange rates
meticais (MZM) per US dollar -
Explore More
Our Partners
Trusted partner applications powering global data and insights