Countries
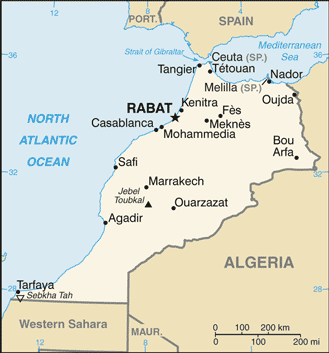
Morocco

Key Economic Indicators
$402.77 billion
$10,415
3.79%
0.99%
9%
$154.431 billion (2024 est.)
64.9% of GDP (2016 est.)
$-1,868,774,290
Economic Overview
lower middle-income North African economy; ongoing recovery from recent drought and earthquake; rebounding via tourism, manufacturing, and raw materials processing; significant trade and investment with EU; reform programs include fiscal rebalancing, state enterprise governance and private sector investments
All Economic Data
Agricultural products
wheat, milk, potatoes, sugar beets, tomatoes, barley, olives, apples, tangerines/mandarins, onions (2023)
note:
<b>note:</b> top ten agricultural products based on tonnage
Average household expenditures
On alcohol and tobacco:
2.1% of household expenditures (2023 est.)
On food:
34.5% of household expenditures (2023 est.)
Budget
Expenditures:
$44.819 billion (2023 est.)
Note:
<b>note:</b> central government revenues and expenses (excluding grants/extrabudgetary units/social security funds) converted to US dollars at average official exchange rate for year indicated
Revenues:
$38.458 billion (2023 est.)
Currency
code:
MAD
name:
Moroccan dirham (MAD) [د.م.]
Current account balance
$-1,868,774,290
Current account balance 2021:
-$3.349 billion (2021 est.)
Current account balance 2022:
-$4.8 billion (2022 est.)
Current account balance 2023:
-$891.222 million (2023 est.)
Note:
<b>note:</b> balance of payments - net trade and primary/secondary income in current dollars
Debt - external
$67.99 billion
Debt - external 2023:
$42.262 billion (2023 est.)
Note:
<b>note:</b> present value of external debt in current US dollars
Exchange rates
Currency:
Moroccan dirhams (MAD) per US dollar -
Exchange rates 2020:
9.497 (2020 est.)
Exchange rates 2021:
8.988 (2021 est.)
Exchange rates 2022:
10.161 (2022 est.)
Exchange rates 2023:
10.131 (2023 est.)
Exchange rates 2024:
9.942 (2024 est.)
Exports
$67.45 billion
Exports 2021:
$47.09 billion (2021 est.)
Exports 2022:
$58.575 billion (2022 est.)
Exports 2023:
$61.746 billion (2023 est.)
Note:
<b>note:</b> balance of payments - exports of goods and services in current dollars
Exports - commodities
fertilizers, cars, garments, insulated wire, tomatoes (2023)
note:
<b>note:</b> top five export commodities based on value in dollars
Exports - partners
Spain 20%, France 17%, Germany 6%, UK 5%, Italy 4% (2023)
note:
<b>note:</b> top five export partners based on percentage share of exports
Foreign direct investment
net inflows:
$1.64 billion
GDP - composition, by end use
Exports of goods and services:
43.3% (2024 est.)
Government consumption:
18% (2024 est.)
Household consumption:
61.3% (2024 est.)
Imports of goods and services:
-52.5% (2024 est.)
Investment in fixed capital:
26.1% (2024 est.)
Investment in inventories:
3.8% (2024 est.)
Note:
<b>note:</b> figures may not total 100% due to rounding or gaps in data collection
GDP - composition, by sector of origin
Agriculture:
10.1% (2024 est.)
Industry:
24.1% (2024 est.)
Note:
<b>note:</b> figures may not total 100% due to non-allocated consumption not captured in sector-reported data
Services:
54.1% (2024 est.)
GDP (official exchange rate)
$154.431 billion (2024 est.)
note:
<b>note:</b> data in current dollars at official exchange rate
GDP per capita (nominal)
$4,153
Gini Index coefficient - distribution of family income
39.5 (2013)
GNI (gross national income)
$158.23 billion
GNI per capita
$3,840
Gross domestic investment
30 % of GDP
Imports
$80.61 billion
Imports 2021:
$60.215 billion (2021 est.)
Imports 2022:
$73.81 billion (2022 est.)
Imports 2023:
$73.759 billion (2023 est.)
Note:
<b>note:</b> balance of payments - imports of goods and services in current dollars
Imports - commodities
refined petroleum, cars, vehicle parts/accessories, natural gas, coal (2023)
note:
<b>note:</b> top five import commodities based on value in dollars
Imports - partners
Spain 16%, China 11%, France 10%, USA 9%, Turkey 5% (2023)
note:
<b>note:</b> top five import partners based on percentage share of imports
Industrial production growth rate
5% (2024 est.)
note:
<b>note:</b> annual % change in industrial value added based on constant local currency
Industries
automotive parts, phosphate mining and processing, aerospace, food processing, leather goods, textiles, construction, energy, tourism
Inflation rate (consumer prices)
0.99%
Inflation rate (consumer prices) 2022:
6.7% (2022 est.)
Inflation rate (consumer prices) 2023:
6.1% (2023 est.)
Inflation rate (consumer prices) 2024:
1% (2024 est.)
Note:
<b>note:</b> annual % change based on consumer prices
Labor force
12.475 million (2024 est.)
note:
<b>note:</b> number of people ages 15 or older who are employed or seeking work
total:
12.63 million persons
Labor force - by occupation
agriculture:
27.89%
industry:
23.83%
services:
48.27%
Population below poverty line
3.9% (2022 est.)
note:
<strong>note:</strong> % of population with income below national poverty line
Public debt
Public debt 2016:
64.9% of GDP (2016 est.)
Real GDP (purchasing power parity)
$402.77 billion
Note:
<b>note:</b> data in 2021 dollars
Real GDP (purchasing power parity) 2022:
$328.425 billion (2022 est.)
Real GDP (purchasing power parity) 2023:
$339.603 billion (2023 est.)
Real GDP (purchasing power parity) 2024:
$350.594 billion (2024 est.)
Real GDP growth rate
3.79%
Note:
<b>note:</b> annual GDP % growth based on constant local currency
Real GDP growth rate 2022:
1.5% (2022 est.)
Real GDP growth rate 2023:
3.4% (2023 est.)
Real GDP growth rate 2024:
3.2% (2024 est.)
Real GDP per capita
$10,415
Note:
<b>note:</b> data in 2021 dollars
Real GDP per capita 2022:
$8,700 (2022 est.)
Real GDP per capita 2023:
$8,900 (2023 est.)
Real GDP per capita 2024:
$9,100 (2024 est.)
Remittances
$12.51 billion
Note:
<b>note:</b> personal transfers and compensation between resident and non-resident individuals/households/entities
Remittances 2021:
7.7% of GDP (2021 est.)
Remittances 2022:
8.5% of GDP (2022 est.)
Remittances 2023:
8.1% of GDP (2023 est.)
Reserves of foreign exchange and gold
$37.13 billion
Note:
<b>note:</b> holdings of gold (year-end prices)/foreign exchange/special drawing rights in current dollars
Reserves of foreign exchange and gold 2022:
$32.314 billion (2022 est.)
Reserves of foreign exchange and gold 2023:
$36.328 billion (2023 est.)
Reserves of foreign exchange and gold 2024:
$37.134 billion (2024 est.)
Revenue (excl grants)
26 % of GDP
Tax revenue
21 % of GDP
Taxes and other revenues
21% (of GDP) (2023 est.)
note:
<b>note:</b> central government tax revenue as a % of GDP
Unemployment rate
9%
Note:
<b>note:</b> % of labor force seeking employment
Unemployment rate 2022:
9.5% (2022 est.)
Unemployment rate 2023:
9.1% (2023 est.)
Unemployment rate 2024:
9% (2024 est.)
Youth unemployment rate (ages 15-24)
Female:
22.4% (2024 est.)
Male:
22% (2024 est.)
Note:
<b>note:</b> % of labor force ages 15-24 seeking employment
Total:
22.1% (2024 est.)
World Bank Indicators
Broad Money
118 (2024)
Current Account Balance (US$)
-1,868,774,289.78 (2024)
Exchange Rate
9.94 (2024)
Exports (US$)
$67.45B (2024)
External Debt
$67.99B (2024)
FDI Net Inflows (US$)
1.02 (2024)
GDP Growth (%)
3.79 (2024)
Gdp Nominal
$49.47B (2024)
GDP Per Capita
4,153 (2024)
GDP (Current US$)
$160.61B (2024)
Gini Index
39.50 (2013)
Government Debt (% GDP)
51.23 (2011)
Govt Expenditure
26.61 (2023)
Govt Revenue
26.15 (2023)
Imports (US$)
$80.61B (2024)
Inflation Rate (%)
0.99 (2024)
Inflation Rate
0.67 (2024)
Population
$38.08M (2024)
Reserves
$37.13B (2024)
Trade Pct Gdp
92.19 (2024)
Unemployment Rate (%)
9.00 (2025)
Unemployment Rate
2.26 (2024)
Youth Unemployment
21.88 (2025)
Economic Rankings
External Debt
#23
Unemployment Rate
#45
Imports
#52
Reserves
#53
GDP (PPP)
#56
Exports
#58
GDP (Nominal)
#59
Gini Index
#69
GDP per Capita
#128
Inflation Rate
#129
GDP Growth Rate
#137
Quick Facts
Industries
automotive parts, phosphate mining and processing, aerospace, food processing, leather goods, textiles, construction, energy, tourism
Agricultural products
wheat, milk, potatoes, sugar beets, tomatoes, barley, olives, apples, tangerines/mandarins, onions (2023)
Labor force
12.475 million (2024 est.)
Exports - partners
Spain 20%, France 17%, Germany 6%, UK 5%, Italy 4% (2023)
Imports - partners
Spain 16%, China 11%, France 10%, USA 9%, Turkey 5% (2023)
Exchange rates
Moroccan dirhams (MAD) per US dollar -
Explore More
Our Partners
Trusted partner applications powering global data and insights