Countries
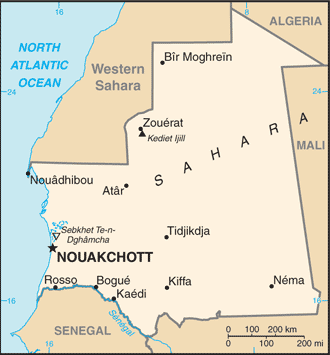
Mauritania

Key Economic Indicators
$38.09 billion
$7,369
6.31%
2.49%
10.32%
$10.767 billion (2024 est.)
100% of GDP (2016 est.)
$-1,039,382,013
Economic Overview
lower middle-income West African economy; primarily agrarian; rising urbanization; poor property rights; systemic corruption; endemic social and workforce tensions; wide-scale terrorism; foreign over-fishing; environmentally fragile
All Economic Data
Agricultural products
rice, milk, goat milk, sorghum, sheep milk, lamb/mutton, beef, camel meat, camel milk, dates (2023)
note:
<b>note:</b> top ten agricultural products based on tonnage
Budget
Expenditures:
$1.407 billion (2019 est.)
Revenues:
$1.617 billion (2019 est.)
Currency
code:
MRU
name:
Mauritanian ouguiya (MRU) [UM]
Current account balance
$-1,039,382,013
Current account balance 2021:
-$807.862 million (2021 est.)
Current account balance 2022:
-$1.424 billion (2022 est.)
Current account balance 2023:
-$966.506 million (2023 est.)
Note:
<b>note:</b> balance of payments - net trade and primary/secondary income in current dollars
Debt - external
$4.46 billion
Debt - external 2023:
$3.072 billion (2023 est.)
Note:
<b>note:</b> present value of external debt in current US dollars
Exchange rates
Currency:
ouguiyas (MRO) per US dollar -
Exchange rates 2019:
36.691 (2019 est.)
Exchange rates 2020:
37.189 (2020 est.)
Exchange rates 2021:
36.063 (2021 est.)
Exchange rates 2022:
36.935 (2022 est.)
Exchange rates 2023:
36.489 (2023 est.)
Exports
$4.52 billion
Exports 2021:
$3.18 billion (2021 est.)
Exports 2022:
$4.132 billion (2022 est.)
Exports 2023:
$3.955 billion (2023 est.)
Note:
<b>note:</b> balance of payments - exports of goods and services in current dollars
Exports - commodities
gold, iron ore, fish, processed crustaceans, copper ore (2023)
note:
<b>note:</b> top five export commodities based on value in dollars
Exports - partners
China 25%, Switzerland 14%, Canada 12%, UAE 9%, Spain 7% (2023)
note:
<b>note:</b> top five export partners based on percentage share of exports
Foreign direct investment
net inflows:
$1.44 billion
GDP - composition, by end use
Exports of goods and services:
38.3% (2023 est.)
Government consumption:
17.2% (2023 est.)
Household consumption:
55.3% (2023 est.)
Imports of goods and services:
-53.2% (2023 est.)
Investment in fixed capital:
23.5% (2023 est.)
Investment in inventories:
18.9% (2023 est.)
Note:
<b>note:</b> figures may not total 100% due to rounding or gaps in data collection
GDP - composition, by sector of origin
Agriculture:
18.6% (2024 est.)
Industry:
30.6% (2024 est.)
Note:
<b>note:</b> figures may not total 100% due to non-allocated consumption not captured in sector-reported data
Services:
43.2% (2024 est.)
GDP (official exchange rate)
$10.767 billion (2024 est.)
note:
<b>note:</b> data in current dollars at official exchange rate
GDP per capita (nominal)
$2,110
Gini Index coefficient - distribution of family income
32.6 (2014)
Gini Index coefficient - distribution of family income 2019:
32 (2019 est.)
Note:
<b>note:</b> index (0-100) of income distribution; higher values represent greater inequality
GNI (gross national income)
$10.8 billion
GNI per capita
$2,120
Gross domestic investment
43 % of GDP
Household income or consumption by percentage share
Highest 10%:
24.6% (2019 est.)
Lowest 10%:
3.1% (2019 est.)
Note:
<b>note:</b> % share of income accruing to lowest and highest 10% of population
Imports
$5.69 billion
Imports 2021:
$4.312 billion (2021 est.)
Imports 2022:
$5.77 billion (2022 est.)
Imports 2023:
$5.271 billion (2023 est.)
Note:
<b>note:</b> balance of payments - imports of goods and services in current dollars
Imports - commodities
refined petroleum, raw sugar, palm oil, wheat, soybean oil (2023)
note:
<b>note:</b> top five import commodities based on value in dollars
Imports - partners
China 19%, UAE 14%, Morocco 6%, Spain 6%, France 5% (2023)
note:
<b>note:</b> top five import partners based on percentage share of imports
Industrial production growth rate
2.8% (2024 est.)
note:
<b>note:</b> annual % change in industrial value added based on constant local currency
Industries
fish processing, oil production, mining (iron ore, gold, copper)
note:
<strong>note:</strong> gypsum deposits have never been exploited
Inflation rate (consumer prices)
2.49%
Inflation rate (consumer prices) 2022:
9.5% (2022 est.)
Inflation rate (consumer prices) 2023:
5% (2023 est.)
Inflation rate (consumer prices) 2024:
2.5% (2024 est.)
Note:
<b>note:</b> annual % change based on consumer prices
Labor force
1.21 million (2024 est.)
note:
<b>note:</b> number of people ages 15 or older who are employed or seeking work
total:
1.25 million persons
Labor force - by occupation
agriculture:
32.12%
industry:
15.04%
services:
52.83%
Population below poverty line
31.8% (2019 est.)
note:
<b>note:</b> % of population with income below national poverty line
Public debt
Public debt 2016:
100% of GDP (2016 est.)
Real GDP (purchasing power parity)
$38.09 billion
Note:
<b>note:</b> data in 2021 dollars
Real GDP (purchasing power parity) 2022:
$29.514 billion (2022 est.)
Real GDP (purchasing power parity) 2023:
$31.434 billion (2023 est.)
Real GDP (purchasing power parity) 2024:
$33.069 billion (2024 est.)
Real GDP growth rate
6.31%
Note:
<b>note:</b> annual GDP % growth based on constant local currency
Real GDP growth rate 2022:
6.8% (2022 est.)
Real GDP growth rate 2023:
6.5% (2023 est.)
Real GDP growth rate 2024:
5.2% (2024 est.)
Real GDP per capita
$7,369
Note:
<b>note:</b> data in 2021 dollars
Real GDP per capita 2022:
$6,100 (2022 est.)
Real GDP per capita 2023:
$6,300 (2023 est.)
Real GDP per capita 2024:
$6,400 (2024 est.)
Remittances
$94.54 million
Note:
<b>note:</b> personal transfers and compensation between resident and non-resident individuals/households/entities
Remittances 2021:
0.1% of GDP (2021 est.)
Remittances 2022:
1.1% of GDP (2022 est.)
Remittances 2023:
1.6% of GDP (2023 est.)
Reserves of foreign exchange and gold
$2.04 billion
Note:
<b>note:</b> holdings of gold (year-end prices)/foreign exchange/special drawing rights in current dollars
Reserves of foreign exchange and gold 2019:
$1.029 billion (2019 est.)
Reserves of foreign exchange and gold 2020:
$1.493 billion (2020 est.)
Reserves of foreign exchange and gold 2021:
$2.039 billion (2021 est.)
Unemployment rate
10.32%
Note:
<b>note:</b> % of labor force seeking employment
Unemployment rate 2022:
10.6% (2022 est.)
Unemployment rate 2023:
10.5% (2023 est.)
Unemployment rate 2024:
10.4% (2024 est.)
Youth unemployment rate (ages 15-24)
Female:
30.1% (2024 est.)
Male:
19.9% (2024 est.)
Note:
<b>note:</b> % of labor force ages 15-24 seeking employment
Total:
23.2% (2024 est.)
World Bank Indicators
Currency
Mauritanian ouguiya (MRU) UM (2025)
Gini Index
32.60 (2014)
Languages
Arabic (2025)
Economic Rankings
Unemployment Rate
#40
GDP Growth Rate
#50
Inflation Rate
#81
External Debt
#86
Reserves
#127
Gini Index
#138
GDP (PPP)
#140
Exports
#142
GDP per Capita
#143
Imports
#146
GDP (Nominal)
#149
Quick Facts
Industries
fish processing, oil production, mining (iron ore, gold, copper)
Agricultural products
rice, milk, goat milk, sorghum, sheep milk, lamb/mutton, beef, camel meat, camel milk, dates (2023)
Labor force
1.21 million (2024 est.)
Exports - partners
China 25%, Switzerland 14%, Canada 12%, UAE 9%, Spain 7% (2023)
Imports - partners
China 19%, UAE 14%, Morocco 6%, Spain 6%, France 5% (2023)
Exchange rates
ouguiyas (MRO) per US dollar -
Explore More
Our Partners
Trusted partner applications powering global data and insights