Countries
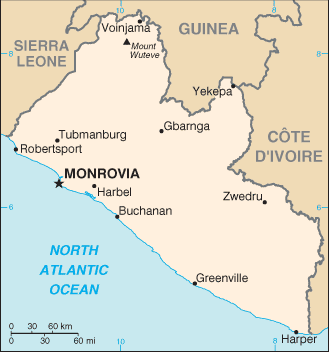
Liberia

Key Economic Indicators
$10.5 billion
$1,871
4.02%
8.21%
2.88%
$4.75 billion (2024 est.)
28.3% of GDP (2016 est.)
$64.81 million
Economic Overview
low-income West African economy; food scarcity, especially in rural areas; high poverty and inflation; bad recession prior to COVID-19 due to Ebola crisis; growing government debt; longest continuously operated rubber plantation; large informal economy
All Economic Data
Agricultural products
cassava, sugarcane, rice, oil palm fruit, bananas, rubber, vegetables, plantains, taro, maize (2023)
note:
<b>note:</b> top ten agricultural products based on tonnage
Budget
Expenditures:
$6 million (2019 est.)
Revenues:
$5 million (2019 est.)
Currency
code:
LRD
name:
Liberian dollar (LRD) [$]
Current account balance
$64.81 million
Current account balance 2020:
-$274.971 million (2020 est.)
Current account balance 2021:
-$101.746 million (2021 est.)
Current account balance 2022:
$64.806 million (2022 est.)
Note:
<b>note:</b> balance of payments - net trade and primary/secondary income in current dollars
Debt - external
$2.23 billion
Debt - external 2023:
$1.335 billion (2023 est.)
Note:
<b>note:</b> present value of external debt in current US dollars
Exchange rates
Currency:
Liberian dollars (LRD) per US dollar -
Exchange rates 2019:
186.43 (2019 est.)
Exchange rates 2020:
191.518 (2020 est.)
Exchange rates 2021:
166.154 (2021 est.)
Exchange rates 2022:
152.934 (2022 est.)
Exchange rates 2023:
174.956 (2023 est.)
Exports
Exports 2020:
$731.658 million (2020 est.)
Exports 2021:
$1.041 billion (2021 est.)
Exports 2022:
$1.22 billion (2022 est.)
Note:
<b>note:</b> balance of payments - exports of goods and services in current dollars
Exports - commodities
gold, ships, iron ore, rubber, refined petroleum (2023)
note:
<b>note:</b> top five export commodities based on value in dollars
Exports - partners
Switzerland 30%, UK 13%, France 8%, Germany 7%, Lebanon 4% (2023)
note:
<b>note:</b> top five export partners based on percentage share of exports
Foreign direct investment
net inflows:
$471.54 million
GDP - composition, by sector of origin
Agriculture:
33.6% (2024 est.)
Industry:
23.3% (2024 est.)
Note:
<b>note:</b> figures may not total 100% due to non-allocated consumption not captured in sector-reported data
Services:
42.1% (2024 est.)
GDP (official exchange rate)
$4.75 billion (2024 est.)
note:
<b>note:</b> data in current dollars at official exchange rate
GDP per capita (nominal)
$851
Gini Index coefficient - distribution of family income
35.3 (2016)
Gini Index coefficient - distribution of family income 2016:
35.3 (2016 est.)
Note:
<b>note:</b> index (0-100) of income distribution; higher values represent greater inequality
GNI (gross national income)
$4.48 billion
GNI per capita
$760
Household income or consumption by percentage share
Highest 10%:
27.1% (2016 est.)
Lowest 10%:
2.9% (2016 est.)
Note:
<b>note:</b> % share of income accruing to lowest and highest 10% of population
Imports
Imports 2020:
$1.371 billion (2020 est.)
Imports 2021:
$1.739 billion (2021 est.)
Imports 2022:
$1.961 billion (2022 est.)
Note:
<b>note:</b> balance of payments - imports of goods and services in current dollars
Imports - commodities
ships, refined petroleum, rice, trucks, centrifuges (2023)
note:
<b>note:</b> top five import commodities based on value in dollars
Imports - partners
China 48%, Japan 21%, Germany 8%, Brazil 3%, Cote d'Ivoire 3% (2023)
note:
<b>note:</b> top five import partners based on percentage share of imports
Industrial production growth rate
6.1% (2024 est.)
note:
<b>note:</b> annual % change in industrial value added based on constant local currency
Industries
mining (iron ore and gold), rubber processing, palm oil processing, diamonds
Inflation rate (consumer prices)
8.21%
Inflation rate (consumer prices) 2021:
7.8% (2021 est.)
Inflation rate (consumer prices) 2022:
7.6% (2022 est.)
Inflation rate (consumer prices) 2023:
10.1% (2023 est.)
Note:
<b>note:</b> annual % change based on consumer prices
Labor force
2.607 million (2024 est.)
note:
<b>note:</b> number of people ages 15 or older who are employed or seeking work
total:
2.67 million persons
Labor force - by occupation
agriculture:
41.12%
industry:
8.35%
services:
50.53%
Population below poverty line
50.9% (2016 est.)
note:
<b>note:</b> % of population with income below national poverty line
Public debt
Public debt 2016:
28.3% of GDP (2016 est.)
Real GDP (purchasing power parity)
$10.5 billion
Note:
<b>note:</b> data in 2021 dollars
Real GDP (purchasing power parity) 2022:
$8.484 billion (2022 est.)
Real GDP (purchasing power parity) 2023:
$8.882 billion (2023 est.)
Real GDP (purchasing power parity) 2024:
$9.308 billion (2024 est.)
Real GDP growth rate
4.02%
Note:
<b>note:</b> annual GDP % growth based on constant local currency
Real GDP growth rate 2022:
4.8% (2022 est.)
Real GDP growth rate 2023:
4.7% (2023 est.)
Real GDP growth rate 2024:
4.8% (2024 est.)
Real GDP per capita
$1,871
Note:
<b>note:</b> data in 2021 dollars
Real GDP per capita 2022:
$1,600 (2022 est.)
Real GDP per capita 2023:
$1,600 (2023 est.)
Real GDP per capita 2024:
$1,700 (2024 est.)
Remittances
$1.02 billion
Note:
<b>note:</b> personal transfers and compensation between resident and non-resident individuals/households/entities
Remittances 2021:
15.1% of GDP (2021 est.)
Remittances 2022:
17.2% of GDP (2022 est.)
Remittances 2023:
18.2% of GDP (2023 est.)
Reserves of foreign exchange and gold
$599.66 million
Note:
<b>note:</b> holdings of gold (year-end prices)/foreign exchange/special drawing rights in current dollars
Reserves of foreign exchange and gold 2020:
$340.966 million (2020 est.)
Reserves of foreign exchange and gold 2021:
$700.829 million (2021 est.)
Reserves of foreign exchange and gold 2022:
$599.66 million (2022 est.)
Unemployment rate
2.88%
Note:
<b>note:</b> % of labor force seeking employment
Unemployment rate 2022:
3% (2022 est.)
Unemployment rate 2023:
3% (2023 est.)
Unemployment rate 2024:
2.9% (2024 est.)
Youth unemployment rate (ages 15-24)
Female:
2% (2024 est.)
Male:
2.2% (2024 est.)
Note:
<b>note:</b> % of labor force ages 15-24 seeking employment
Total:
2.1% (2024 est.)
World Bank Indicators
Currency
Swiss franc (CHF) Fr (2025)
Languages
German (2025)
Economic Rankings
Inflation Rate
#72
External Debt
#102
Gini Index
#107
GDP Growth Rate
#107
Reserves
#150
Unemployment Rate
#151
GDP (Nominal)
#160
GDP (PPP)
#161
Imports
#165
Exports
#169
GDP per Capita
#190
Quick Facts
Industries
mining (iron ore and gold), rubber processing, palm oil processing, diamonds
Agricultural products
cassava, sugarcane, rice, oil palm fruit, bananas, rubber, vegetables, plantains, taro, maize (2023)
Labor force
2.607 million (2024 est.)
Exports - partners
Switzerland 30%, UK 13%, France 8%, Germany 7%, Lebanon 4% (2023)
Imports - partners
China 48%, Japan 21%, Germany 8%, Brazil 3%, Cote d'Ivoire 3% (2023)
Exchange rates
Liberian dollars (LRD) per US dollar -
Explore More
Our Partners
Trusted partner applications powering global data and insights