Countries
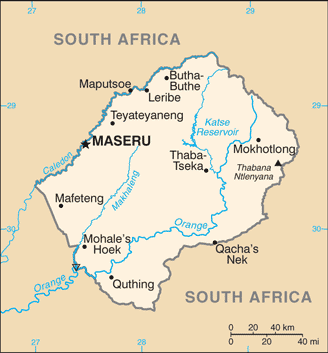
Lesotho

Key Economic Indicators
$7.01 billion
$3,001
2.85%
6.11%
16.32%
$2.272 billion (2024 est.)
<b>note:</b> central government debt as a % of GDP
$89.24 million
Economic Overview
lower middle-income economy surrounded by South Africa; environmentally fragile and politically unstable; key infrastructure and renewable energy investments; dire poverty; urban job and income losses due to COVID-19; systemic corruption
All Economic Data
Agricultural products
milk, potatoes, maize, vegetables, fruits, sorghum, wheat, game meat, beans, wool (2023)
note:
<b>note:</b> top ten agricultural products based on tonnage
Budget
Expenditures:
$1.256 billion (2022 est.)
Note:
<b>note:</b> central government revenues and expenses (excluding grants/extrabudgetary units/social security funds) converted to US dollars at average official exchange rate for year indicated
Revenues:
$1.13 billion (2022 est.)
Currency
code:
LSL, ZAR
name:
Lesotho loti (LSL) [L], South African rand (ZAR) [R]
Current account balance
$89.24 million
Current account balance 2022:
-$268.876 million (2022 est.)
Current account balance 2023:
-$151.577 million (2023 est.)
Current account balance 2024:
$84.393 million (2024 est.)
Note:
<b>note:</b> balance of payments - net trade and primary/secondary income in current dollars
Debt - external
$1.77 billion
Debt - external 2023:
$928.019 million (2023 est.)
Note:
<b>note:</b> present value of external debt in current US dollars
Exchange rates
Currency:
maloti (LSL) per US dollar -
Exchange rates 2020:
16.459 (2020 est.)
Exchange rates 2021:
14.779 (2021 est.)
Exchange rates 2022:
16.356 (2022 est.)
Exchange rates 2023:
18.45 (2023 est.)
Exchange rates 2024:
18.329 (2024 est.)
Exports
$909.09 million
Exports 2022:
$1.07 billion (2022 est.)
Exports 2023:
$885.789 million (2023 est.)
Exports 2024:
$983.027 million (2024 est.)
Note:
<b>note:</b> balance of payments - exports of goods and services in current dollars
Exports - commodities
diamonds, garments, wool, power equipment, bedding (2023)
note:
<b>note:</b> top five export commodities based on value in dollars
Exports - partners
South Africa 31%, Belgium 26%, USA 20%, UAE 8%, India 8% (2023)
note:
<b>note:</b> top five export partners based on percentage share of exports
Foreign direct investment
net inflows:
$-12,572,108
GDP - composition, by end use
Exports of goods and services:
42.9% (2023 est.)
Government consumption:
35.6% (2023 est.)
Household consumption:
92.9% (2023 est.)
Imports of goods and services:
-98.6% (2023 est.)
Investment in fixed capital:
28.3% (2023 est.)
Investment in inventories:
-1.1% (2023 est.)
Note:
<b>note:</b> figures may not total 100% due to rounding or gaps in data collection
GDP - composition, by sector of origin
Agriculture:
6.5% (2024 est.)
Industry:
31% (2024 est.)
Note:
<b>note:</b> figures may not total 100% due to non-allocated consumption not captured in sector-reported data
Services:
48% (2024 est.)
GDP (official exchange rate)
$2.272 billion (2024 est.)
note:
<b>note:</b> data in current dollars at official exchange rate
GDP per capita (nominal)
$972
Gini Index coefficient - distribution of family income
44.9 (2017)
Gini Index coefficient - distribution of family income 2017:
44.9 (2017 est.)
Note:
<b>note:</b> index (0-100) of income distribution; higher values represent greater inequality
GNI (gross national income)
$2.71 billion
GNI per capita
$1,180
Gross domestic investment
27 % of GDP
Household income or consumption by percentage share
Highest 10%:
32.9% (2017 est.)
Lowest 10%:
1.7% (2017 est.)
Note:
<b>note:</b> % share of income accruing to lowest and highest 10% of population
Imports
$2.09 billion
Imports 2022:
$2.247 billion (2022 est.)
Imports 2023:
$2.077 billion (2023 est.)
Imports 2024:
$2.083 billion (2024 est.)
Note:
<b>note:</b> balance of payments - imports of goods and services in current dollars
Imports - commodities
refined petroleum, fabric, trucks, garments, cotton fabric (2023)
note:
<b>note:</b> top five import commodities based on value in dollars
Imports - partners
South Africa 78%, China 10%, Taiwan 3%, Japan 1%, India 1% (2023)
note:
<b>note:</b> top five import partners based on percentage share of imports
Industrial production growth rate
2.6% (2024 est.)
note:
<b>note:</b> annual % change in industrial value added based on constant local currency
Industries
food, beverages, textiles, apparel assembly, handicrafts, construction, tourism
Inflation rate (consumer prices)
6.11%
Inflation rate (consumer prices) 2022:
8.3% (2022 est.)
Inflation rate (consumer prices) 2023:
6.3% (2023 est.)
Inflation rate (consumer prices) 2024:
6.1% (2024 est.)
Note:
<b>note:</b> annual % change based on consumer prices
Labor force
884,200 (2024 est.)
note:
<b>note:</b> number of people ages 15 or older who are employed or seeking work
total:
889,530 persons
Labor force - by occupation
agriculture:
30.88%
industry:
33.04%
services:
36.09%
Population below poverty line
49.7% (2017 est.)
note:
<b>note:</b> % of population with income below national poverty line
Public debt
Note:
<b>note:</b> central government debt as a % of GDP
Public debt 2020:
3% of GDP (2020 est.)
Real GDP (purchasing power parity)
$7.01 billion
Note:
<b>note:</b> data in 2021 dollars
Real GDP (purchasing power parity) 2022:
$5.893 billion (2022 est.)
Real GDP (purchasing power parity) 2023:
$6 billion (2023 est.)
Real GDP (purchasing power parity) 2024:
$6.166 billion (2024 est.)
Real GDP growth rate
2.85%
Note:
<b>note:</b> annual GDP % growth based on constant local currency
Real GDP growth rate 2022:
2.4% (2022 est.)
Real GDP growth rate 2023:
1.8% (2023 est.)
Real GDP growth rate 2024:
2.8% (2024 est.)
Real GDP per capita
$3,001
Note:
<b>note:</b> data in 2021 dollars
Real GDP per capita 2022:
$2,600 (2022 est.)
Real GDP per capita 2023:
$2,600 (2023 est.)
Real GDP per capita 2024:
$2,600 (2024 est.)
Remittances
$475.82 million
Note:
<b>note:</b> personal transfers and compensation between resident and non-resident individuals/households/entities
Remittances 2022:
22.6% of GDP (2022 est.)
Remittances 2023:
22.9% of GDP (2023 est.)
Remittances 2024:
22% of GDP (2024 est.)
Reserves of foreign exchange and gold
$1.01 billion
Note:
<b>note:</b> holdings of gold (year-end prices)/foreign exchange/special drawing rights in current dollars
Reserves of foreign exchange and gold 2022:
$771.278 million (2022 est.)
Reserves of foreign exchange and gold 2023:
$854.089 million (2023 est.)
Reserves of foreign exchange and gold 2024:
$1.008 billion (2024 est.)
Revenue (excl grants)
44 % of GDP
Tax revenue
37 % of GDP
Taxes and other revenues
30.4% (of GDP) (2022 est.)
note:
<b>note:</b> central government tax revenue as a % of GDP
Unemployment rate
16.32%
Note:
<b>note:</b> % of labor force seeking employment
Unemployment rate 2022:
16.7% (2022 est.)
Unemployment rate 2023:
16.5% (2023 est.)
Unemployment rate 2024:
16.2% (2024 est.)
Youth unemployment rate (ages 15-24)
Female:
36.2% (2024 est.)
Male:
17.7% (2024 est.)
Note:
<b>note:</b> % of labor force ages 15-24 seeking employment
Total:
24.2% (2024 est.)
World Bank Indicators
Currency
euro (EUR) (2025)
Gini Index
35.70 (2018)
Languages
Lithuanian (2025)
Economic Rankings
Unemployment Rate
#14
Gini Index
#33
External Debt
#104
Inflation Rate
#104
Reserves
#140
GDP Growth Rate
#158
Imports
#163
GDP (PPP)
#168
Exports
#171
GDP (Nominal)
#172
GDP per Capita
#177
Quick Facts
Industries
food, beverages, textiles, apparel assembly, handicrafts, construction, tourism
Agricultural products
milk, potatoes, maize, vegetables, fruits, sorghum, wheat, game meat, beans, wool (2023)
Labor force
884,200 (2024 est.)
Exports - partners
South Africa 31%, Belgium 26%, USA 20%, UAE 8%, India 8% (2023)
Imports - partners
South Africa 78%, China 10%, Taiwan 3%, Japan 1%, India 1% (2023)
Exchange rates
maloti (LSL) per US dollar -
Explore More
Our Partners
Trusted partner applications powering global data and insights