Countries
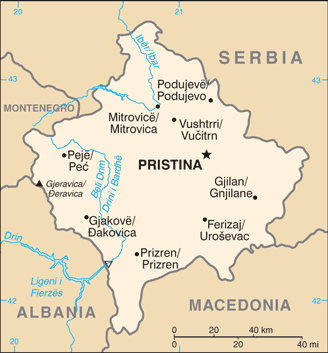
Kosovo

Key Economic Indicators
$28.48 billion
$17,864
4.57%
1.62%
$11.149 billion (2024 est.)
19.4% of GDP (2016 est.)
$-932,481,356
Economic Overview
small-but-growing European economy; non-EU member but unilateral euro user; very high unemployment, especially youth; vulnerable reliance on diaspora tourism services, curtailed by COVID-19 disruptions; unclear public loan portfolio health
All Economic Data
Agricultural products
wheat, corn, berries, potatoes, peppers, fruit; dairy, livestock; fish
Budget
Expenditures:
$2.547 billion (2020 est.)
Revenues:
$1.951 billion (2020 est.)
Currency
code:
EUR
name:
euro (EUR) [€]
Current account balance
$-932,481,356
Current account balance 2021:
-$818.351 million (2021 est.)
Current account balance 2022:
-$983.283 million (2022 est.)
Current account balance 2023:
-$785.09 million (2023 est.)
Note:
<b>note:</b> balance of payments - net trade and primary/secondary income in current dollars
Debt - external
$4.4 billion
Debt - external 2023:
$785.739 million (2023 est.)
Note:
<strong>note:</strong> present value of external debt in current US dollars
Exchange rates
Currency:
euros (EUR) per US dollar -
Exchange rates 2020:
0.877 (2020 est.)
Exchange rates 2021:
0.845 (2021 est.)
Exchange rates 2022:
0.951 (2022 est.)
Exchange rates 2023:
0.925 (2023 est.)
Exchange rates 2024:
0.924 (2024 est.)
Note:
<strong>note: </strong>Kosovo, which is neither an EU member state nor a party to a formal EU monetary agreement, uses the euro as its de facto currency
Exports
$4.67 billion
Exports 2021:
$3.138 billion (2021 est.)
Exports 2022:
$3.579 billion (2022 est.)
Exports 2023:
$4.156 billion (2023 est.)
Note:
<b>note:</b> balance of payments - exports of goods and services in current dollars
Exports - commodities
mattress materials, iron alloys, metal piping, scrap iron, building plastics (2021)
note:
top five export commodities based on value in dollars
Exports - partners
United States 16%, Albania 15%, North Macedonia 12%, Germany 8%, Italy 8% (2021)
Foreign direct investment
net inflows:
$859.81 million
GDP - composition, by end use
Exports of goods and services:
41.9% (2024 est.)
Government consumption:
12.3% (2024 est.)
Household consumption:
84.3% (2024 est.)
Imports of goods and services:
-72.3% (2024 est.)
Investment in fixed capital:
33.8% (2024 est.)
Investment in inventories:
0% (2024 est.)
Note:
<b>note:</b> figures may not total 100% due to rounding or gaps in data collection
GDP - composition, by sector of origin
Agriculture:
6.9% (2024 est.)
Industry:
26.2% (2024 est.)
Note:
<b>note:</b> figures may not total 100% due to non-allocated consumption not captured in sector-reported data
Services:
45.7% (2024 est.)
GDP (official exchange rate)
$11.149 billion (2024 est.)
note:
<b>note:</b> data in current dollars at official exchange rate
GDP per capita (nominal)
$7,023
Gini Index coefficient - distribution of family income
29 (2017)
Gini Index coefficient - distribution of family income 2021:
49.4 (2021 est.)
Note:
<b>note:</b> index (0-100) of income distribution; higher values represent greater inequality
GNI (gross national income)
$11.46 billion
GNI per capita
$6,910
Gross domestic investment
34 % of GDP
Household income or consumption by percentage share
Highest 10%:
32.9% (2021 est.)
Lowest 10%:
0.4% (2021 est.)
Note:
<b>note:</b> % share of income accruing to lowest and highest 10% of population
Imports
$8.07 billion
Imports 2021:
$6.128 billion (2021 est.)
Imports 2022:
$6.661 billion (2022 est.)
Imports 2023:
$7.362 billion (2023 est.)
Note:
<b>note:</b> balance of payments - imports of goods and services in current dollars
Imports - commodities
refined petroleum, cars, iron rods, electricity, cigars, packaged medicines (2021)
Imports - partners
Germany 13%, Turkey 13%, China 10%, Serbia 7%, Italy 6% (2021)
Industrial production growth rate
4% (2024 est.)
note:
<b>note:</b> annual % change in industrial value added based on constant local currency
Industries
mineral mining, construction materials, base metals, leather, machinery, appliances, foodstuffs and beverages, textiles
Inflation rate (consumer prices)
1.62%
Inflation rate (consumer prices) 2022:
11.6% (2022 est.)
Inflation rate (consumer prices) 2023:
4.9% (2023 est.)
Inflation rate (consumer prices) 2024:
1.6% (2024 est.)
Note:
<b>note:</b> annual % change based on consumer prices
Labor force
500,300 (2017 est.)
note:
<strong>note:</strong> includes those estimated to be employed in the gray economy
Population below poverty line
17.6% (2015 est.)
note:
<b>note:</b> % of population with income below national poverty line
Public debt
Public debt 2016:
19.4% of GDP (2016 est.)
Real GDP (purchasing power parity)
$28.48 billion
Note:
<b>note:</b> data in 2021 dollars
Real GDP (purchasing power parity) 2022:
$23.025 billion (2022 est.)
Real GDP (purchasing power parity) 2023:
$23.962 billion (2023 est.)
Real GDP (purchasing power parity) 2024:
$25.019 billion (2024 est.)
Real GDP growth rate
4.57%
Note:
<b>note:</b> annual GDP % growth based on constant local currency
Real GDP growth rate 2022:
4.3% (2022 est.)
Real GDP growth rate 2023:
4.1% (2023 est.)
Real GDP growth rate 2024:
4.4% (2024 est.)
Real GDP per capita
$17,864
Note:
<b>note:</b> data in 2021 dollars
Real GDP per capita 2022:
$13,000 (2022 est.)
Real GDP per capita 2023:
$14,200 (2023 est.)
Real GDP per capita 2024:
$16,400 (2024 est.)
Remittances
$1.94 billion
Note:
<b>note:</b> personal transfers and compensation between resident and non-resident individuals/households/entities
Remittances 2021:
18% of GDP (2021 est.)
Remittances 2022:
17.2% of GDP (2022 est.)
Remittances 2023:
17.5% of GDP (2023 est.)
Reserves of foreign exchange and gold
$1.31 billion
Note:
<b>note:</b> holdings of gold (year-end prices)/foreign exchange/special drawing rights in current dollars
Reserves of foreign exchange and gold 2022:
$1.248 billion (2022 est.)
Reserves of foreign exchange and gold 2023:
$1.245 billion (2023 est.)
Reserves of foreign exchange and gold 2024:
$1.31 billion (2024 est.)
Economic Rankings
Gini Index
#18
Inflation Rate
#58
External Debt
#87
GDP per Capita
#99
GDP Growth Rate
#109
Imports
#133
Reserves
#137
Exports
#141
GDP (Nominal)
#147
GDP (PPP)
#149
Quick Facts
Industries
mineral mining, construction materials, base metals, leather, machinery, appliances, foodstuffs and beverages, textiles
Agricultural products
wheat, corn, berries, potatoes, peppers, fruit; dairy, livestock; fish
Labor force
500,300 (2017 est.)
Exports - partners
United States 16%, Albania 15%, North Macedonia 12%, Germany 8%, Italy 8% (2021)
Imports - partners
Germany 13%, Turkey 13%, China 10%, Serbia 7%, Italy 6% (2021)
Exchange rates
euros (EUR) per US dollar -
Explore More
Our Partners
Trusted partner applications powering global data and insights