Countries
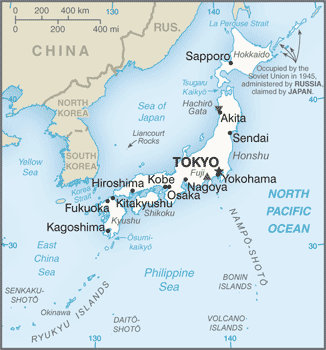
Japan

Key Economic Indicators
$6.45 trillion
$52,039
0.1%
2.74%
2.45%
$4.026 trillion (2024 est.)
<b>note:</b> central government debt as a % of GDP
$194.26 billion
Economic Overview
second-largest East Asian economy; trade-oriented and highly diversified; high public debt levels; following years of near-zero interest rates, gradual increases to address inflation and depreciation of yen; strong rebound in tourism; aging population poses challenges to labor force participation
All Economic Data
Agricultural products
rice, milk, sugar beets, vegetables, eggs, chicken, potatoes, onions, cabbages, pork (2023)
note:
<b>note:</b> top ten agricultural products based on tonnage
Average household expenditures
On alcohol and tobacco:
2.5% of household expenditures (2023 est.)
On food:
15.8% of household expenditures (2023 est.)
Budget
Expenditures:
$897.03 billion (2022 est.)
Note:
<b>note:</b> central government revenues and expenditures (excluding grants and social security funds) converted to US dollars at average official exchange rate for year indicated
Revenues:
$661.986 billion (2022 est.)
Currency
code:
JPY
name:
Japanese yen (JPY) [¥]
Current account balance
$194.26 billion
Current account balance 2022:
$90.21 billion (2022 est.)
Current account balance 2023:
$156.592 billion (2023 est.)
Current account balance 2024:
$194.257 billion (2024 est.)
Note:
<b>note:</b> balance of payments - net trade and primary/secondary income in current dollars
Exchange rates
Currency:
yen (JPY) per US dollar -
Exchange rates 2020:
106.775 (2020 est.)
Exchange rates 2021:
109.754 (2021 est.)
Exchange rates 2022:
131.498 (2022 est.)
Exchange rates 2023:
140.491 (2023 est.)
Exchange rates 2024:
151.366 (2024 est.)
Exports
$917.04 billion
Exports 2022:
$922.813 billion (2022 est.)
Exports 2023:
$923.488 billion (2023 est.)
Exports 2024:
$922.447 billion (2024 est.)
Note:
<b>note:</b> balance of payments - exports of goods and services in current dollars
Exports - commodities
cars, integrated circuits, machinery, vehicle parts/accessories, construction vehicles (2023)
note:
<b>note:</b> top five export commodities based on value in dollars
Exports - partners
USA 19%, China 18%, Taiwan 6%, S. Korea 6%, Hong Kong 4% (2023)
note:
<b>note:</b> top five export partners based on percentage share of exports
Foreign direct investment
net inflows:
$16.16 billion
GDP - composition, by end use
Exports of goods and services:
21.5% (2022 est.)
Government consumption:
21.6% (2022 est.)
Household consumption:
55.5% (2022 est.)
Imports of goods and services:
-25.3% (2022 est.)
Investment in fixed capital:
26.3% (2022 est.)
Investment in inventories:
0.5% (2022 est.)
Note:
<b>note:</b> figures may not total 100% due to rounding or gaps in data collection
GDP - composition, by sector of origin
Agriculture:
0.9% (2023 est.)
Industry:
28.6% (2023 est.)
Note:
<b>note:</b> figures may not total 100% due to non-allocated consumption not captured in sector-reported data
Services:
69.8% (2023 est.)
GDP (official exchange rate)
$4.026 trillion (2024 est.)
note:
<b>note:</b> data in current dollars at official exchange rate
GDP per capita (nominal)
$32,487
Gini Index coefficient - distribution of family income
32.9 (2013)
Gini Index coefficient - distribution of family income 2020:
32.3 (2020 est.)
Note:
<strong>note:</strong> index (0-100) of income distribution; higher values represent greater inequality
GNI (gross national income)
$4.29 trillion
GNI per capita
$36,000
Gross domestic investment
26 % of GDP
Household income or consumption by percentage share
Highest 10%:
23.9% (2020 est.)
Lowest 10%:
2.4% (2020 est.)
Note:
<strong>note:</strong> % share of income accruing to lowest and highest 10% of population
Imports
$952.04 billion
Imports 2022:
$1.081 trillion (2022 est.)
Imports 2023:
$996.364 billion (2023 est.)
Imports 2024:
$965.047 billion (2024 est.)
Note:
<b>note:</b> balance of payments - imports of goods and services in current dollars
Imports - commodities
crude petroleum, natural gas, coal, integrated circuits, broadcasting equipment (2023)
note:
<b>note:</b> top five import commodities based on value in dollars
Imports - partners
China 22%, USA 11%, Australia 8%, UAE 5%, Saudi Arabia 5% (2023)
note:
<b>note:</b> top five import partners based on percentage share of imports
Industrial production growth rate
1.4% (2023 est.)
note:
<b>note:</b> annual % change in industrial value added based on constant local currency
Industries
motor vehicles, electronic equipment, machine tools, steel and nonferrous metals, ships, chemicals, textiles, processed foods
Inflation rate (consumer prices)
2.74%
Inflation rate (consumer prices) 2022:
2.5% (2022 est.)
Inflation rate (consumer prices) 2023:
3.3% (2023 est.)
Inflation rate (consumer prices) 2024:
2.7% (2024 est.)
Note:
<b>note:</b> annual % change based on consumer prices
Labor force
69.382 million (2024 est.)
note:
<b>note:</b> number of people ages 15 or older who are employed or seeking work
total:
69.39 million persons
Labor force - by occupation
agriculture:
2.81%
industry:
23.23%
services:
73.96%
Public debt
Note:
<b>note:</b> central government debt as a % of GDP
Public debt 2022:
215.9% of GDP (2022 est.)
Real GDP (purchasing power parity)
$6.45 trillion
Note:
<b>note:</b> data in 2021 dollars
Real GDP (purchasing power parity) 2022:
$5.627 trillion (2022 est.)
Real GDP (purchasing power parity) 2023:
$5.71 trillion (2023 est.)
Real GDP (purchasing power parity) 2024:
$5.715 trillion (2024 est.)
Real GDP growth rate
0.1%
Note:
<b>note:</b> annual GDP % growth based on constant local currency
Real GDP growth rate 2022:
0.9% (2022 est.)
Real GDP growth rate 2023:
1.5% (2023 est.)
Real GDP growth rate 2024:
0.1% (2024 est.)
Real GDP per capita
$52,039
Note:
<b>note:</b> data in 2021 dollars
Real GDP per capita 2022:
$45,000 (2022 est.)
Real GDP per capita 2023:
$45,900 (2023 est.)
Real GDP per capita 2024:
$46,100 (2024 est.)
Remittances
$4.64 billion
Note:
<b>note:</b> personal transfers and compensation between resident and non-resident individuals/households/entities
Remittances 2022:
0.1% of GDP (2022 est.)
Remittances 2023:
0.1% of GDP (2023 est.)
Remittances 2024:
0.1% of GDP (2024 est.)
Reserves of foreign exchange and gold
$1.23 trillion
Note:
<b>note:</b> holdings of gold (year-end prices)/foreign exchange/special drawing rights in current dollars
Reserves of foreign exchange and gold 2022:
$1.228 trillion (2022 est.)
Reserves of foreign exchange and gold 2023:
$1.295 trillion (2023 est.)
Reserves of foreign exchange and gold 2024:
$1.231 trillion (2024 est.)
Unemployment rate
2.45%
Note:
<b>note:</b> % of labor force seeking employment
Unemployment rate 2022:
2.6% (2022 est.)
Unemployment rate 2023:
2.6% (2023 est.)
Unemployment rate 2024:
2.6% (2024 est.)
Youth unemployment rate (ages 15-24)
Female:
3.7% (2024 est.)
Male:
4.2% (2024 est.)
Note:
<b>note:</b> % of labor force ages 15-24 seeking employment
Total:
3.9% (2024 est.)
Economic Rankings
Reserves
#2
GDP (Nominal)
#4
GDP (PPP)
#5
Imports
#6
Exports
#8
GDP per Capita
#40
Gini Index
#133
Unemployment Rate
#161
GDP Growth Rate
#179
Inflation Rate
#182
Quick Facts
Industries
motor vehicles, electronic equipment, machine tools, steel and nonferrous metals, ships, chemicals, textiles, processed foods
Agricultural products
rice, milk, sugar beets, vegetables, eggs, chicken, potatoes, onions, cabbages, pork (2023)
Labor force
69.382 million (2024 est.)
Exports - partners
USA 19%, China 18%, Taiwan 6%, S. Korea 6%, Hong Kong 4% (2023)
Imports - partners
China 22%, USA 11%, Australia 8%, UAE 5%, Saudi Arabia 5% (2023)
Exchange rates
yen (JPY) per US dollar -
Explore More
Our Partners
Trusted partner applications powering global data and insights