Countries
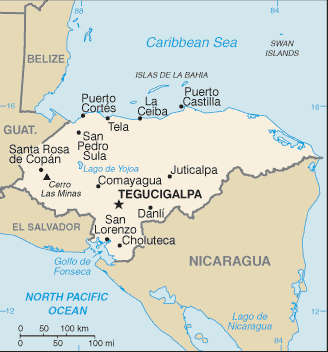
Honduras

Key Economic Indicators
$81.04 billion
$7,486
3.55%
4.61%
4.92%
$37.094 billion (2024 est.)
38.5% of GDP (2016 est.)
$-1,649,482,994
Economic Overview
second-fastest-growing Central American economy; COVID-19 and two hurricanes crippled activity; high poverty and inequality; declining-but-still-high violent crime disruption; systemic corruption; coffee and banana exporter; enormous remittances
All Economic Data
Agricultural products
sugarcane, oil palm fruit, maize, milk, bananas, coffee, cantaloupes/melons, oranges, chicken, beans (2023)
note:
<b>note:</b> top ten agricultural products based on tonnage
Average household expenditures
On alcohol and tobacco:
4.9% of household expenditures (2023 est.)
On food:
31.5% of household expenditures (2023 est.)
Budget
Expenditures:
$6.391 billion (2020 est.)
Note:
<b>note:</b> central government revenues (excluding grants) and expenditures converted to US dollars at average official exchange rate for year indicated
Revenues:
$5.333 billion (2020 est.)
Currency
code:
HNL
name:
Honduran lempira (HNL) [L]
Current account balance
$-1,649,482,994
Current account balance 2022:
-$2.157 billion (2022 est.)
Current account balance 2023:
-$1.368 billion (2023 est.)
Current account balance 2024:
-$1.711 billion (2024 est.)
Note:
<b>note:</b> balance of payments - net trade and primary/secondary income in current dollars
Debt - external
$14.3 billion
Debt - external 2023:
$7.785 billion (2023 est.)
Note:
<b>note:</b> present value of external debt in current US dollars
Exchange rates
Currency:
lempiras (HNL) per US dollar -
Exchange rates 2020:
24.582 (2020 est.)
Exchange rates 2021:
24.017 (2021 est.)
Exchange rates 2022:
24.486 (2022 est.)
Exchange rates 2023:
24.602 (2023 est.)
Exchange rates 2024:
24.799 (2024 est.)
Exports
$12.44 billion
Exports 2022:
$9.51 billion (2022 est.)
Exports 2023:
$9.805 billion (2023 est.)
Exports 2024:
$9.352 billion (2024 est.)
Note:
<b>note:</b> balance of payments - exports of goods and services in current dollars
Exports - commodities
garments, coffee, insulated wire, palm oil, shellfish (2023)
note:
<b>note:</b> top five export commodities based on value in dollars
Exports - partners
USA 49%, Nicaragua 8%, El Salvador 7%, Guatemala 5%, Mexico 5% (2023)
note:
<b>note:</b> top five export partners based on percentage share of exports
Foreign direct investment
net inflows:
$1.31 billion
GDP - composition, by end use
Exports of goods and services:
33.5% (2024 est.)
Government consumption:
15.5% (2024 est.)
Household consumption:
86% (2024 est.)
Imports of goods and services:
-57.6% (2024 est.)
Investment in fixed capital:
23.9% (2024 est.)
Investment in inventories:
-1.4% (2024 est.)
Note:
<b>note:</b> figures may not total 100% due to rounding or gaps in data collection
GDP - composition, by sector of origin
Agriculture:
11.2% (2024 est.)
Industry:
26.1% (2024 est.)
Note:
<b>note:</b> figures may not total 100% due to non-allocated consumption not captured in sector-reported data
Services:
58.4% (2024 est.)
GDP (official exchange rate)
$37.094 billion (2024 est.)
note:
<b>note:</b> data in current dollars at official exchange rate
GDP per capita (nominal)
$3,426
Gini Index coefficient - distribution of family income
48.2 (2019)
Gini Index coefficient - distribution of family income 2023:
46.8 (2023 est.)
Note:
<b>note:</b> index (0-100) of income distribution; higher values represent greater inequality
GNI (gross national income)
$34.19 billion
GNI per capita
$3,020
Gross domestic investment
22 % of GDP
Household income or consumption by percentage share
Highest 10%:
33% (2023 est.)
Lowest 10%:
1.1% (2023 est.)
Note:
<b>note:</b> % share of income accruing to lowest and highest 10% of population
Imports
$21.35 billion
Imports 2022:
$18.101 billion (2022 est.)
Imports 2023:
$17.926 billion (2023 est.)
Imports 2024:
$18.235 billion (2024 est.)
Note:
<b>note:</b> balance of payments - imports of goods and services in current dollars
Imports - commodities
refined petroleum, cotton yarn, garments, trucks, packaged medicine (2023)
note:
<b>note:</b> top five import commodities based on value in dollars
Imports - partners
USA 36%, China 14%, Guatemala 8%, Mexico 6%, El Salvador 6% (2023)
note:
<b>note:</b> top five import partners based on percentage share of imports
Industrial production growth rate
0.8% (2024 est.)
note:
<b>note:</b> annual % change in industrial value added based on constant local currency
Industries
sugar processing, coffee, woven and knit apparel, wood products, cigars
Inflation rate (consumer prices)
4.61%
Inflation rate (consumer prices) 2022:
9.1% (2022 est.)
Inflation rate (consumer prices) 2023:
6.7% (2023 est.)
Inflation rate (consumer prices) 2024:
4.6% (2024 est.)
Note:
<b>note:</b> annual % change based on consumer prices
Labor force
4.296 million (2024 est.)
note:
<b>note:</b> number of people ages 15 or older who are employed or seeking work
total:
4.34 million persons
Labor force - by occupation
agriculture:
22.42%
industry:
21.64%
services:
55.94%
Population below poverty line
64.1% (2023 est.)
note:
<b>note:</b> % of population with income below national poverty line
Public debt
Public debt 2016:
38.5% of GDP (2016 est.)
Real GDP (purchasing power parity)
$81.04 billion
Note:
<b>note:</b> data in 2021 dollars
Real GDP (purchasing power parity) 2022:
$66.473 billion (2022 est.)
Real GDP (purchasing power parity) 2023:
$68.85 billion (2023 est.)
Real GDP (purchasing power parity) 2024:
$71.297 billion (2024 est.)
Real GDP growth rate
3.55%
Note:
<b>note:</b> annual GDP % growth based on constant local currency
Real GDP growth rate 2022:
4.1% (2022 est.)
Real GDP growth rate 2023:
3.6% (2023 est.)
Real GDP growth rate 2024:
3.6% (2024 est.)
Real GDP per capita
$7,486
Note:
<b>note:</b> data in 2021 dollars
Real GDP per capita 2022:
$6,400 (2022 est.)
Real GDP per capita 2023:
$6,500 (2023 est.)
Real GDP per capita 2024:
$6,600 (2024 est.)
Remittances
$9.53 billion
Note:
<b>note:</b> personal transfers and compensation between resident and non-resident individuals/households/entities
Remittances 2022:
27% of GDP (2022 est.)
Remittances 2023:
26.1% of GDP (2023 est.)
Remittances 2024:
25.7% of GDP (2024 est.)
Reserves of foreign exchange and gold
$8.04 billion
Note:
<b>note:</b> holdings of gold (year-end prices)/foreign exchange/special drawing rights in current dollars
Reserves of foreign exchange and gold 2022:
$8.41 billion (2022 est.)
Reserves of foreign exchange and gold 2023:
$7.543 billion (2023 est.)
Reserves of foreign exchange and gold 2024:
$8.036 billion (2024 est.)
Taxes and other revenues
15.1% (of GDP) (2020 est.)
note:
<b>note:</b> central government tax revenue as a % of GDP
Unemployment rate
4.92%
Note:
<b>note:</b> % of labor force seeking employment
Unemployment rate 2022:
8.8% (2022 est.)
Unemployment rate 2023:
6.1% (2023 est.)
Unemployment rate 2024:
6.1% (2024 est.)
Youth unemployment rate (ages 15-24)
Female:
15.9% (2024 est.)
Male:
7.9% (2024 est.)
Note:
<b>note:</b> % of labor force ages 15-24 seeking employment
Total:
10.5% (2024 est.)
Economic Rankings
Gini Index
#22
Unemployment Rate
#53
External Debt
#59
Reserves
#86
Inflation Rate
#87
Imports
#94
GDP (Nominal)
#102
GDP (PPP)
#107
Exports
#108
GDP Growth Rate
#128
GDP per Capita
#142
Quick Facts
Industries
sugar processing, coffee, woven and knit apparel, wood products, cigars
Agricultural products
sugarcane, oil palm fruit, maize, milk, bananas, coffee, cantaloupes/melons, oranges, chicken, beans (2023)
Labor force
4.296 million (2024 est.)
Exports - partners
USA 49%, Nicaragua 8%, El Salvador 7%, Guatemala 5%, Mexico 5% (2023)
Imports - partners
USA 36%, China 14%, Guatemala 8%, Mexico 6%, El Salvador 6% (2023)
Exchange rates
lempiras (HNL) per US dollar -
Explore More
Our Partners
Trusted partner applications powering global data and insights