Countries
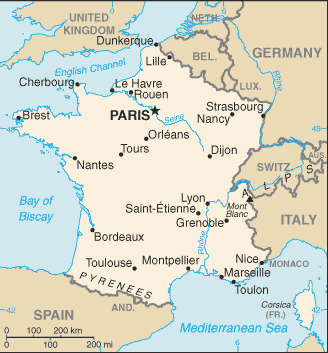
France

Key Economic Indicators
$4.29 trillion
$62,557
1.19%
2%
7.54%
$3.162 trillion (2024 est.)
<b>note:</b> central government debt as a % of GDP
$2.69 billion
Economic Overview
<p>high-income, advanced EU economy and eurozone member; strong tourism, aircraft manufacturing, pharmaceuticals, and industrial sectors; high public debt; ongoing pension reform efforts; transitioning to a green economy via "France 2030" strategy</p>
All Economic Data
Agricultural products
wheat, sugar beets, milk, maize, barley, potatoes, grapes, rapeseed, pork, sunflower seeds (2023)
note:
<b>note:</b> top ten agricultural products based on tonnage
Average household expenditures
On alcohol and tobacco:
3.5% of household expenditures (2023 est.)
On food:
12.6% of household expenditures (2023 est.)
Budget
Expenditures:
$1.447 trillion (2023 est.)
Note:
<b>note:</b> central government revenues (excluding grants) and expenditures converted to US dollars at average official exchange rate for year indicated
Revenues:
$1.29 trillion (2023 est.)
Currency
code:
EUR
name:
euro (EUR) [€]
Current account balance
$2.69 billion
Current account balance 2022:
-$33.069 billion (2022 est.)
Current account balance 2023:
-$30.334 billion (2023 est.)
Current account balance 2024:
$12.382 billion (2024 est.)
Note:
<b>note:</b> balance of payments - net trade and primary/secondary income in current dollars
Exchange rates
Currency:
euros (EUR) per US dollar -
Exchange rates 2020:
0.876 (2020 est.)
Exchange rates 2021:
0.845 (2021 est.)
Exchange rates 2022:
0.95 (2022 est.)
Exchange rates 2023:
0.925 (2023 est.)
Exchange rates 2024:
0.924 (2024 est.)
Exports
$1.07 trillion
Exports 2022:
$1.021 trillion (2022 est.)
Exports 2023:
$1.05 trillion (2023 est.)
Exports 2024:
$1.071 trillion (2024 est.)
Note:
<b>note:</b> balance of payments - exports of goods and services in current dollars
Exports - commodities
aircraft, cars, packaged medicine, gas turbines, vehicle parts/accessories (2023)
note:
<b>note:</b> top five export commodities based on value in dollars
Exports - partners
Germany 11%, Italy 9%, USA 8%, Belgium 8%, Spain 7% (2023)
note:
<b>note:</b> top five export partners based on percentage share of exports
Foreign direct investment
net inflows:
$52.05 billion
GDP - composition, by end use
Exports of goods and services:
34.3% (2023 est.)
Government consumption:
23.1% (2023 est.)
Household consumption:
53.4% (2023 est.)
Imports of goods and services:
-36.3% (2023 est.)
Investment in fixed capital:
23.1% (2023 est.)
Investment in inventories:
0.1% (2023 est.)
Note:
<b>note:</b> figures may not total 100% due to rounding or gaps in data collection
GDP - composition, by sector of origin
Agriculture:
1.4% (2024 est.)
Industry:
17.5% (2024 est.)
Note:
<b>note:</b> figures may not total 100% due to non-allocated consumption not captured in sector-reported data
Services:
70.4% (2024 est.)
GDP (official exchange rate)
$3.162 trillion (2024 est.)
note:
<b>note:</b> data in current dollars at official exchange rate
GDP per capita (nominal)
$46,103
Gini Index coefficient - distribution of family income
32.4 (2018)
Gini Index coefficient - distribution of family income 2022:
31.2 (2022 est.)
Note:
<b>note:</b> index (0-100) of income distribution; higher values represent greater inequality
GNI (gross national income)
$3.22 trillion
GNI per capita
$45,160
Gross domestic investment
22 % of GDP
Household income or consumption by percentage share
Highest 10%:
24.6% (2022 est.)
Lowest 10%:
3% (2022 est.)
Note:
<b>note:</b> % share of income accruing to lowest and highest 10% of population
Imports
$1.08 trillion
Imports 2022:
$1.092 trillion (2022 est.)
Imports 2023:
$1.094 trillion (2023 est.)
Imports 2024:
$1.074 trillion (2024 est.)
Note:
<b>note:</b> balance of payments - imports of goods and services in current dollars
Imports - commodities
cars, natural gas, crude petroleum, refined petroleum, garments (2023)
note:
<b>note:</b> top five import commodities based on value in dollars
Imports - partners
Germany 15%, Belgium 11%, Netherlands 9%, Spain 8%, Italy 8% (2023)
note:
<b>note:</b> top five import partners based on percentage share of imports
Industrial production growth rate
0.7% (2024 est.)
note:
<b>note:</b> annual % change in industrial value added based on constant local currency
Industries
machinery, chemicals, automobiles, metallurgy, aircraft, electronics, textiles, food processing, tourism
Inflation rate (consumer prices)
2%
Inflation rate (consumer prices) 2022:
5.2% (2022 est.)
Inflation rate (consumer prices) 2023:
4.9% (2023 est.)
Inflation rate (consumer prices) 2024:
2% (2024 est.)
Note:
<b>note:</b> annual % change based on consumer prices
Labor force
31.725 million (2024 est.)
note:
<b>note:</b> number of people ages 15 or older who are employed or seeking work
total:
31.83 million persons
Labor force - by occupation
agriculture:
2.33%
industry:
19.34%
services:
78.33%
Population below poverty line
15.6% (2021 est.)
note:
<b>note:</b> % of population with income below national poverty line
Public debt
Note:
<b>note:</b> central government debt as a % of GDP
Public debt 2023:
98.5% of GDP (2023 est.)
Real GDP (purchasing power parity)
$4.29 trillion
Note:
<b>note:</b> data in 2021 dollars
Real GDP (purchasing power parity) 2022:
$3.655 trillion (2022 est.)
Real GDP (purchasing power parity) 2023:
$3.689 trillion (2023 est.)
Real GDP (purchasing power parity) 2024:
$3.732 trillion (2024 est.)
Real GDP growth rate
1.19%
Note:
<b>note:</b> annual GDP % growth based on constant local currency
Real GDP growth rate 2022:
2.6% (2022 est.)
Real GDP growth rate 2023:
0.9% (2023 est.)
Real GDP growth rate 2024:
1.2% (2024 est.)
Real GDP per capita
$62,557
Note:
<strong>note:</strong> data in 2021 dollars
Real GDP per capita 2022:
$53,700 (2022 est.)
Real GDP per capita 2023:
$54,000 (2023 est.)
Real GDP per capita 2024:
$54,500 (2024 est.)
Remittances
$38.78 billion
Note:
<b>note:</b> personal transfers and compensation between resident and non-resident individuals/households/entities
Remittances 2022:
1.2% of GDP (2022 est.)
Remittances 2023:
1.2% of GDP (2023 est.)
Remittances 2024:
1.2% of GDP (2024 est.)
Reserves of foreign exchange and gold
$282.86 billion
Note:
<b>note:</b> holdings of gold (year-end prices)/foreign exchange/special drawing rights in current dollars
Reserves of foreign exchange and gold 2022:
$242.416 billion (2022 est.)
Reserves of foreign exchange and gold 2023:
$240.792 billion (2023 est.)
Reserves of foreign exchange and gold 2024:
$282.857 billion (2024 est.)
Revenue (excl grants)
42 % of GDP
Tax revenue
23 % of GDP
Taxes and other revenues
23.1% (of GDP) (2023 est.)
note:
<b>note:</b> central government tax revenue as a % of GDP
Unemployment rate
7.54%
Note:
<b>note:</b> % of labor force seeking employment
Unemployment rate 2022:
7.4% (2022 est.)
Unemployment rate 2023:
7.4% (2023 est.)
Unemployment rate 2024:
7.4% (2024 est.)
Youth unemployment rate (ages 15-24)
Female:
16% (2024 est.)
Male:
17.1% (2024 est.)
Note:
<b>note:</b> % of labor force ages 15-24 seeking employment
Total:
16.6% (2024 est.)
World Bank Indicators
Currency
euro (EUR) (2025)
Gdp Nominal
$3,160.44B (2024)
GDP Per Capita
46,103 (2024)
Gini Index
32.40 (2018)
Inflation Rate
2.00 (2024)
Languages
French (2025)
Unemployment Rate
7.40 (2024)
Economic Rankings
Exports
#5
Imports
#5
GDP (Nominal)
#7
GDP (PPP)
#10
Reserves
#13
GDP per Capita
#29
Unemployment Rate
#65
Gini Index
#139
Inflation Rate
#159
GDP Growth Rate
#168
Quick Facts
Industries
machinery, chemicals, automobiles, metallurgy, aircraft, electronics, textiles, food processing, tourism
Agricultural products
wheat, sugar beets, milk, maize, barley, potatoes, grapes, rapeseed, pork, sunflower seeds (2023)
Labor force
31.725 million (2024 est.)
Exports - partners
Germany 11%, Italy 9%, USA 8%, Belgium 8%, Spain 7% (2023)
Imports - partners
Germany 15%, Belgium 11%, Netherlands 9%, Spain 8%, Italy 8% (2023)
Exchange rates
euros (EUR) per US dollar -
Explore More
Our Partners
Trusted partner applications powering global data and insights