Countries
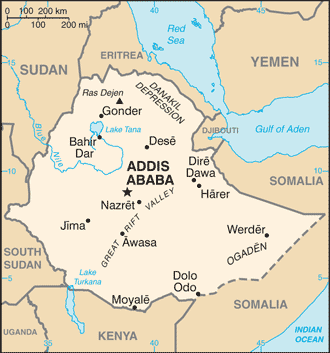
Ethiopia

Key Economic Indicators
$434.15 billion
$3,288
7.61%
21.04%
3.32%
$126.773 billion (2022 est.)
<b>note:</b> central government debt as a % of GDP
$-3,791,072,162
Economic Overview
<p>low-income, fast-growing Horn of Africa economy; widespread poverty and food insecurity worsened by conflict and environmental factors; landlocked with tensions over seaport access; development aid supporting reforms to boost private-sector growth and financial stability; challenge of creating jobs for growing labor force</p>
All Economic Data
Agricultural products
maize, cereals, wheat, milk, sorghum, barley, taro, beans, sweet potatoes, potatoes (2023)
note:
<b>note:</b> top ten agricultural products based on tonnage
Average household expenditures
On alcohol and tobacco:
3.1% of household expenditures (2023 est.)
On food:
37.9% of household expenditures (2023 est.)
Budget
Expenditures:
$12.49 billion (2023 est.)
Note:
<b>note:</b> central government revenues and expenses (excluding grants/extrabudgetary units/social security funds) converted to US dollars at average official exchange rate for year indicated
Revenues:
$8.808 billion (2023 est.)
Currency
code:
ETB
name:
Ethiopian birr (ETB) [Br]
Current account balance
$-3,791,072,162
Current account balance 2021:
-$4.507 billion (2021 est.)
Current account balance 2022:
-$5.16 billion (2022 est.)
Current account balance 2023:
-$4.788 billion (2023 est.)
Note:
<b>note:</b> balance of payments - net trade and primary/secondary income in current dollars
Debt - external
$36.55 billion
Debt - external 2023:
$25.426 billion (2023 est.)
Note:
<b>note:</b> present value of external debt in current US dollars
Exchange rates
Currency:
birr (ETB) per US dollar -
Exchange rates 2019:
29.07 (2019 est.)
Exchange rates 2020:
34.927 (2020 est.)
Exchange rates 2021:
43.734 (2021 est.)
Exchange rates 2022:
51.756 (2022 est.)
Exchange rates 2023:
54.601 (2023 est.)
Exports
$8.29 billion
Exports 2021:
$9.496 billion (2021 est.)
Exports 2022:
$10.971 billion (2022 est.)
Exports 2023:
$10.865 billion (2023 est.)
Note:
<b>note:</b> balance of payments - exports of goods and services in current dollars
Exports - commodities
coffee, garments, dried legumes, cut flowers, oil seeds (2023)
note:
<b>note:</b> top five export commodities based on value in dollars
Exports - partners
USA 12%, China 10%, UAE 8%, Saudi Arabia 8%, Netherlands 5% (2023)
note:
<b>note:</b> top five export partners based on percentage share of exports
Foreign direct investment
net inflows:
$4.02 billion
GDP - composition, by end use
Exports of goods and services:
5.6% (2024 est.)
Government consumption:
5.5% (2024 est.)
Household consumption:
80.2% (2024 est.)
Imports of goods and services:
-11.8% (2024 est.)
Investment in fixed capital:
20.5% (2024 est.)
Investment in inventories:
0% (2024 est.)
Note:
<strong>note:</strong> figures may not total 100% due to rounding or gaps in data collection
GDP - composition, by sector of origin
Agriculture:
34.9% (2024 est.)
Industry:
25.4% (2024 est.)
Note:
<b>note:</b> figures may not total 100% due to non-allocated consumption not captured in sector-reported data
Services:
37.6% (2024 est.)
GDP (official exchange rate)
$126.773 billion (2022 est.)
note:
<b>note:</b> data in current dollars at official exchange rate
GDP per capita (nominal)
$1,134
Gini Index coefficient - distribution of family income
35 (2015)
Gini Index coefficient - distribution of family income 2021:
31.1 (2021 est.)
Note:
<b>note:</b> index (0-100) of income distribution; higher values represent greater inequality
GNI (gross national income)
$149.5 billion
GNI per capita
$1,100
Gross domestic investment
21 % of GDP
Household income or consumption by percentage share
Highest 10%:
24.8% (2021 est.)
Lowest 10%:
3.5% (2021 est.)
Note:
<b>note:</b> % share of income accruing to lowest and highest 10% of population
Imports
$17.76 billion
Imports 2021:
$20.859 billion (2021 est.)
Imports 2022:
$24.187 billion (2022 est.)
Imports 2023:
$22.951 billion (2023 est.)
Note:
<b>note:</b> balance of payments - imports of goods and services in current dollars
Imports - commodities
refined petroleum, fertilizers, plastics, raw sugar, cars (2023)
note:
<b>note:</b> top five import commodities based on value in dollars
Imports - partners
China 26%, Djibouti 16%, India 7%, Kuwait 7%, Saudi Arabia 6% (2023)
note:
<b>note:</b> top five import partners based on percentage share of imports
Industrial production growth rate
9.2% (2024 est.)
note:
<b>note:</b> annual % change in industrial value added based on constant local currency
Industries
food processing, beverages, textiles, leather, garments, chemicals, metals processing, cement
Inflation rate (consumer prices)
21.04%
Inflation rate (consumer prices) 2022:
33.9% (2022 est.)
Inflation rate (consumer prices) 2023:
30.2% (2023 est.)
Inflation rate (consumer prices) 2024:
21% (2024 est.)
Note:
<b>note:</b> annual % change based on consumer prices
Labor force
54.47 million (2024 est.)
note:
<b>note:</b> number of people ages 15 or older who are employed or seeking work
total:
56.78 million persons
Labor force - by occupation
agriculture:
60.14%
industry:
6.45%
services:
33.41%
Population below poverty line
23.5% (2015 est.)
note:
<b>note:</b> % of population with income below national poverty line
Public debt
Note:
<b>note:</b> central government debt as a % of GDP
Public debt 2019:
31.4% of GDP (2019 est.)
Real GDP (purchasing power parity)
$434.15 billion
Note:
<b>note:</b> data in 2021 dollars
Real GDP (purchasing power parity) 2022:
$332.97 billion (2022 est.)
Real GDP (purchasing power parity) 2023:
$354.926 billion (2023 est.)
Real GDP (purchasing power parity) 2024:
$380.895 billion (2024 est.)
Real GDP growth rate
7.61%
Note:
<b>note:</b> annual GDP % growth based on constant local currency
Real GDP growth rate 2022:
5.3% (2022 est.)
Real GDP growth rate 2023:
6.6% (2023 est.)
Real GDP growth rate 2024:
7.3% (2024 est.)
Real GDP per capita
$3,288
Note:
<b>note:</b> data in 2021 dollars
Real GDP per capita 2022:
$2,700 (2022 est.)
Real GDP per capita 2023:
$2,800 (2023 est.)
Real GDP per capita 2024:
$2,900 (2024 est.)
Remittances
$7.14 billion
Note:
<b>note:</b> personal transfers and compensation between resident and non-resident individuals/households/entities
Remittances 2021:
0.4% of GDP (2021 est.)
Remittances 2022:
0.4% of GDP (2022 est.)
Remittances 2023:
0.33% of GDP (2023 est.)
Reserves of foreign exchange and gold
$3.78 billion
Note:
<b>note:</b> holdings of gold (year-end prices)/foreign exchange/special drawing rights in current dollars
Reserves of foreign exchange and gold 2022:
$1.192 billion (2022 est.)
Reserves of foreign exchange and gold 2023:
$2.028 billion (2023 est.)
Reserves of foreign exchange and gold 2024:
$3.784 billion (2024 est.)
Revenue (excl grants)
4 % of GDP
Tax revenue
3 % of GDP
Taxes and other revenues
3.9% (of GDP) (2023 est.)
note:
<b>note:</b> central government tax revenue as a % of GDP
Unemployment rate
3.32%
Note:
<b>note:</b> % of labor force seeking employment
Unemployment rate 2022:
3.5% (2022 est.)
Unemployment rate 2023:
3.5% (2023 est.)
Unemployment rate 2024:
3.4% (2024 est.)
Youth unemployment rate (ages 15-24)
Female:
7.2% (2024 est.)
Male:
4% (2024 est.)
Note:
<b>note:</b> % of labor force ages 15-24 seeking employment
Total:
5.4% (2024 est.)
World Bank Indicators
Currency
Ethiopian birr (ETB) Br (2025)
Gini Index
35.00 (2015)
Languages
Amharic (2025)
Economic Rankings
Inflation Rate
#19
GDP Growth Rate
#36
External Debt
#38
GDP (PPP)
#54
GDP (Nominal)
#62
Imports
#90
Reserves
#111
Gini Index
#112
Exports
#113
Unemployment Rate
#138
GDP per Capita
#172
Quick Facts
Industries
food processing, beverages, textiles, leather, garments, chemicals, metals processing, cement
Agricultural products
maize, cereals, wheat, milk, sorghum, barley, taro, beans, sweet potatoes, potatoes (2023)
Labor force
54.47 million (2024 est.)
Exports - partners
USA 12%, China 10%, UAE 8%, Saudi Arabia 8%, Netherlands 5% (2023)
Imports - partners
China 26%, Djibouti 16%, India 7%, Kuwait 7%, Saudi Arabia 6% (2023)
Exchange rates
birr (ETB) per US dollar -
Explore More
Our Partners
Trusted partner applications powering global data and insights