Countries
Eswatini

Key Economic Indicators
$14.66 billion
$11,799
2.97%
6.2% (2017 est.)
34.2%
$4.892 billion (2024 est.)
36 % of GDP
$78.33 million
Economic Overview
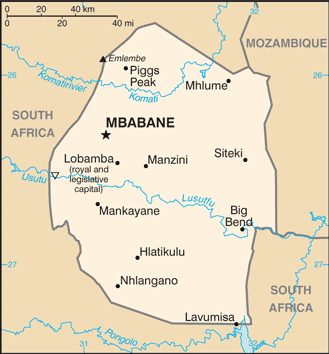
landlocked southern African economy; South African trade dependent and currency pegging; CMA and SACU member state; COVID-19 economic slowdown; growing utilities inflation; persistent poverty and unemployment; HIV/AIDS labor force disruptions
All Economic Data
Agricultural products
sugarcane, maize, root vegetables, grapefruits, oranges, milk, pineapples, bananas, beef, sweet potatoes (2023)
note:
<b>note:</b> top ten agricultural products based on tonnage
Budget
Expenditures:
$1.439 billion (2021 est.)
Note:
<b>note:</b> central government revenues and expenses (excluding grants/extrabudgetary units/social security funds) converted to US dollars at average official exchange rate for year indicated
Revenues:
$1.217 billion (2021 est.)
Currency
code:
SZL, ZAR
name:
Swazi lilangeni (SZL) [L], South African rand (ZAR) [R]
Current account balance
$78.33 million
Current account balance 2021:
$125.318 million (2021 est.)
Current account balance 2022:
-$140.972 million (2022 est.)
Current account balance 2023:
$107.534 million (2023 est.)
Note:
<b>note:</b> balance of payments - net trade and primary/secondary income in current dollars
Debt - external
$1.24 billion
Debt - external 2023:
$923.266 million (2023 est.)
Note:
<b>note:</b> present value of external debt in current US dollars
Exchange rates
Currency:
emalangeni per US dollar -
Exchange rates 2020:
16.47 (2020 est.)
Exchange rates 2021:
14.783 (2021 est.)
Exchange rates 2022:
16.362 (2022 est.)
Exchange rates 2023:
18.454 (2023 est.)
Exchange rates 2024:
18.318 (2024 est.)
Exports
$2.61 billion
Exports 2021:
$2.132 billion (2021 est.)
Exports 2022:
$2.095 billion (2022 est.)
Exports 2023:
$2.174 billion (2023 est.)
Note:
<b>note:</b> balance of payments - exports of goods and services in current dollars
Exports - commodities
scented mixtures, raw sugar, industrial acids/oils/alcohols, garments, wood (2023)
note:
<b>note:</b> top five export commodities based on value in dollars
Exports - partners
South Africa 61%, Ireland 4%, Mozambique 4%, Kenya 4%, Nigeria 3% (2023)
note:
<b>note:</b> top five export partners based on percentage share of exports
Foreign direct investment
net inflows:
$75.53 million
GDP - composition, by end use
Exports of goods and services:
48.7% (2023 est.)
Government consumption:
19.5% (2023 est.)
Household consumption:
64% (2023 est.)
Imports of goods and services:
-51.4% (2023 est.)
Investment in fixed capital:
16.1% (2023 est.)
Investment in inventories:
3.1% (2023 est.)
Note:
<strong>note:</strong> figures may not total 100% due to rounding or gaps in data collection
GDP - composition, by sector of origin
Agriculture:
6.8% (2023 est.)
Industry:
34.7% (2023 est.)
Note:
<b>note:</b> figures may not total 100% due to non-allocated consumption not captured in sector-reported data
Services:
51.7% (2023 est.)
GDP (official exchange rate)
$4.892 billion (2024 est.)
note:
<b>note:</b> data in current dollars at official exchange rate
GDP per capita (nominal)
$3,910
Gini Index coefficient - distribution of family income
54.6 (2016)
Gini Index coefficient - distribution of family income 2016:
54.6 (2016 est.)
Note:
<b>note:</b> index (0-100) of income distribution; higher values represent greater inequality
GNI (gross national income)
$4.43 billion
GNI per capita
$3,590
Gross domestic investment
15 % of GDP
Household income or consumption by percentage share
Highest 10%:
42.7% (2016 est.)
Lowest 10%:
1.4% (2016 est.)
Note:
<b>note:</b> % share of income accruing to lowest and highest 10% of population
Imports
$2.61 billion
Imports 2021:
$2.173 billion (2021 est.)
Imports 2022:
$2.288 billion (2022 est.)
Imports 2023:
$2.351 billion (2023 est.)
Note:
<b>note:</b> balance of payments - imports of goods and services in current dollars
Imports - commodities
refined petroleum, electricity, plastic products, cotton fabric, garments (2023)
note:
<b>note:</b> top five import commodities based on value in dollars
Imports - partners
South Africa 71%, China 8%, India 4%, USA 2%, Mozambique 1% (2023)
note:
<b>note:</b> top five import partners based on percentage share of imports
Industrial production growth rate
0.5% (2023 est.)
note:
<b>note:</b> annual % change in industrial value added based on constant local currency
Industries
soft drink concentrates, coal, forestry, sugar processing, textiles, and apparel
Inflation rate (consumer prices)
Inflation rate (consumer prices) 2017:
6.2% (2017 est.)
Inflation rate (consumer prices) 2018:
4.8% (2018 est.)
Inflation rate (consumer prices) 2019:
2.6% (2019 est.)
Note:
<b>note:</b> annual % change based on consumer prices
Labor force
390,600 (2024 est.)
note:
<b>note:</b> number of people ages 15 or older who are employed or seeking work
total:
430,869 persons
Labor force - by occupation
agriculture:
14.55%
industry:
26.73%
services:
58.72%
Population below poverty line
58.9% (2016 est.)
note:
<b>note:</b> % of population with income below national poverty line
Public debt
36 % of GDP
Note:
<strong>note:</strong> central government debt as a % of GDP
Public debt 2021:
35.9% of GDP (2021 est.)
Real GDP (purchasing power parity)
$14.66 billion
Note:
<b>note:</b> data in 2021 dollars
Real GDP (purchasing power parity) 2022:
$12.135 billion (2022 est.)
Real GDP (purchasing power parity) 2023:
$12.553 billion (2023 est.)
Real GDP (purchasing power parity) 2024:
$12.885 billion (2024 est.)
Real GDP growth rate
2.97%
Note:
<b>note:</b> annual GDP % growth based on constant local currency
Real GDP growth rate 2022:
1.1% (2022 est.)
Real GDP growth rate 2023:
3.4% (2023 est.)
Real GDP growth rate 2024:
2.6% (2024 est.)
Real GDP per capita
$11,799
Note:
<b>note:</b> data in 2021 dollars
Real GDP per capita 2022:
$10,000 (2022 est.)
Real GDP per capita 2023:
$10,200 (2023 est.)
Real GDP per capita 2024:
$10,400 (2024 est.)
Remittances
$33.35 million
Note:
<b>note:</b> personal transfers and compensation between resident and non-resident individuals/households/entities
Remittances 2021:
2.8% of GDP (2021 est.)
Remittances 2022:
2.7% of GDP (2022 est.)
Remittances 2023:
1.7% of GDP (2023 est.)
Reserves of foreign exchange and gold
$479.26 million
Note:
<b>note:</b> holdings of gold (year-end prices)/foreign exchange/special drawing rights in current dollars
Reserves of foreign exchange and gold 2021:
$572.282 million (2021 est.)
Reserves of foreign exchange and gold 2022:
$452.352 million (2022 est.)
Reserves of foreign exchange and gold 2023:
$479.261 million (2023 est.)
Revenue (excl grants)
25 % of GDP
Tax revenue
24 % of GDP
Taxes and other revenues
24.5% (of GDP) (2021 est.)
note:
<strong>note:</strong> central government tax revenue as a % of GDP
Unemployment rate
34.2%
Note:
<b>note:</b> % of labor force seeking employment
Unemployment rate 2022:
35.4% (2022 est.)
Unemployment rate 2023:
35.1% (2023 est.)
Unemployment rate 2024:
34.4% (2024 est.)
Youth unemployment rate (ages 15-24)
Female:
60.3% (2024 est.)
Male:
56% (2024 est.)
Note:
<b>note:</b> % of labor force ages 15-24 seeking employment
Total:
58.2% (2024 est.)
Economic Rankings
Unemployment Rate
#1
Gini Index
#8
External Debt
#108
GDP per Capita
#122
Inflation Rate
#139
GDP Growth Rate
#147
Exports
#154
GDP (PPP)
#156
Reserves
#156
Imports
#159
GDP (Nominal)
#159
Quick Facts
Industries
soft drink concentrates, coal, forestry, sugar processing, textiles, and apparel
Agricultural products
sugarcane, maize, root vegetables, grapefruits, oranges, milk, pineapples, bananas, beef, sweet potatoes (2023)
Labor force
390,600 (2024 est.)
Exports - partners
South Africa 61%, Ireland 4%, Mozambique 4%, Kenya 4%, Nigeria 3% (2023)
Imports - partners
South Africa 71%, China 8%, India 4%, USA 2%, Mozambique 1% (2023)
Exchange rates
emalangeni per US dollar -
Explore More
Our Partners
Trusted partner applications powering global data and insights