Countries
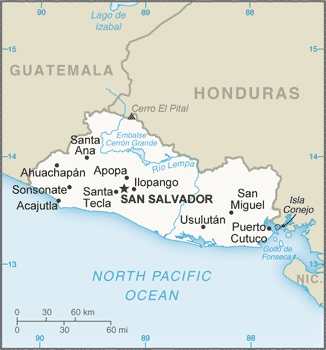
El Salvador
Key Economic Indicators
$84.07 billion
$13,264
2.6%
0.85%
3.3%
$35.365 billion (2024 est.)
106 % of GDP
$-632,548,681
Economic Overview
upper-middle-income, dollarized Central American economy; reliant on remittances from US; recent growth linked to infrastructure investment, consumption, and crime reduction; $1.3 billion IMF loan to address fiscal imbalances; Bitcoin adopted as legal tender; persistent poverty and large informal sector
All Economic Data
Agricultural products
sugarcane, maize, milk, chicken, sorghum, beans, oranges, coconuts, eggs, mangoes/guavas (2023)
note:
<b>note:</b> top ten agricultural products based on tonnage
Average household expenditures
On alcohol and tobacco:
0.5% of household expenditures (2023 est.)
On food:
26.7% of household expenditures (2023 est.)
Budget
Expenditures:
$10.313 billion (2023 est.)
Note:
<b>note:</b> central government revenues (excluding grants) and expenditures converted to US dollars at average official exchange rate for year indicated
Revenues:
$9.359 billion (2023 est.)
Currency
code:
USD
name:
United States dollar (USD) [$]
Current account balance
$-632,548,681
Current account balance 2022:
-$2.144 billion (2022 est.)
Current account balance 2023:
-$367.831 million (2023 est.)
Current account balance 2024:
-$632.549 million (2024 est.)
Note:
<b>note:</b> balance of payments - net trade and primary/secondary income in current dollars
Debt - external
$24.96 billion
Debt - external 2023:
$12.668 billion (2023 est.)
Note:
<b>note:</b> present value of external debt in current US dollars
Exchange rates
the US dollar is used as a medium of exchange and circulates freely in the economy
Exports
$11.59 billion
Exports 2022:
$10.164 billion (2022 est.)
Exports 2023:
$10.629 billion (2023 est.)
Exports 2024:
$11.586 billion (2024 est.)
Note:
<b>note:</b> balance of payments - exports of goods and services in current dollars
Exports - commodities
garments, plastic products, electrical capacitors, raw sugar, toilet paper (2023)
note:
<b>note:</b> top five export commodities based on value in dollars
Exports - partners
USA 36%, Guatemala 17%, Honduras 15%, Nicaragua 8%, Costa Rica 5% (2023)
note:
<b>note:</b> top five export partners based on percentage share of exports
Foreign direct investment
net inflows:
$923.88 million
GDP - composition, by end use
Exports of goods and services:
32.8% (2024 est.)
Government consumption:
19.2% (2024 est.)
Household consumption:
79.6% (2024 est.)
Imports of goods and services:
-51.9% (2024 est.)
Investment in fixed capital:
22.2% (2024 est.)
Investment in inventories:
-1.9% (2024 est.)
Note:
<b>note:</b> figures may not total 100% due to rounding or gaps in data collection
GDP - composition, by sector of origin
Agriculture:
4.4% (2024 est.)
Industry:
22.4% (2024 est.)
Note:
<b>note:</b> figures may not total 100% due to non-allocated consumption not captured in sector-reported data
Services:
61% (2024 est.)
GDP (official exchange rate)
$35.365 billion (2024 est.)
note:
<b>note:</b> data in current dollars at official exchange rate
GDP per capita (nominal)
$5,580
Gini Index coefficient - distribution of family income
38.8 (2019)
Gini Index coefficient - distribution of family income 2023:
39.8 (2023 est.)
Note:
<b>note:</b> index (0-100) of income distribution; higher values represent greater inequality
GNI (gross national income)
$33.11 billion
GNI per capita
$5,120
Gross domestic investment
20 % of GDP
Household income or consumption by percentage share
Highest 10%:
29.7% (2023 est.)
Lowest 10%:
1.9% (2023 est.)
Note:
<b>note:</b> % share of income accruing to lowest and highest 10% of population
Imports
$18.35 billion
Imports 2022:
$18.181 billion (2022 est.)
Imports 2023:
$17.034 billion (2023 est.)
Imports 2024:
$18.354 billion (2024 est.)
Note:
<b>note:</b> balance of payments - imports of goods and services in current dollars
Imports - commodities
refined petroleum, natural gas, garments, packaged medicine, plastics (2023)
note:
<b>note:</b> top five import commodities based on value in dollars
Imports - partners
USA 28%, China 15%, Guatemala 11%, Mexico 8%, Honduras 5% (2023)
note:
<b>note:</b> top five import partners based on percentage share of imports
Industrial production growth rate
0.4% (2024 est.)
note:
<b>note:</b> annual % change in industrial value added based on constant local currency
Industries
food processing, beverages, petroleum, chemicals, fertilizer, textiles, furniture, light metals
Inflation rate (consumer prices)
0.85%
Inflation rate (consumer prices) 2022:
7.2% (2022 est.)
Inflation rate (consumer prices) 2023:
4% (2023 est.)
Inflation rate (consumer prices) 2024:
0.9% (2024 est.)
Note:
<b>note:</b> annual % change based on consumer prices
Labor force
2.89 million (2024 est.)
note:
<b>note:</b> number of people ages 15 or older who are employed or seeking work
total:
2.99 million persons
Labor force - by occupation
agriculture:
13.85%
industry:
23.14%
services:
63.01%
Population below poverty line
26.6% (2022 est.)
note:
<b>note:</b> % of population with income below national poverty line
Public debt
106 % of GDP
Note:
<b>note:</b> central government debt as a % of GDP
Public debt 2023:
102.2% of GDP (2023 est.)
Real GDP (purchasing power parity)
$84.07 billion
Note:
<b>note:</b> data in 2021 dollars
Real GDP (purchasing power parity) 2022:
$69.621 billion (2022 est.)
Real GDP (purchasing power parity) 2023:
$72.085 billion (2023 est.)
Real GDP (purchasing power parity) 2024:
$73.961 billion (2024 est.)
Real GDP growth rate
2.6%
Note:
<b>note:</b> annual GDP % growth based on constant local currency
Real GDP growth rate 2022:
3% (2022 est.)
Real GDP growth rate 2023:
3.5% (2023 est.)
Real GDP growth rate 2024:
2.6% (2024 est.)
Real GDP per capita
$13,264
Note:
<b>note:</b> data in 2021 dollars
Real GDP per capita 2022:
$11,100 (2022 est.)
Real GDP per capita 2023:
$11,400 (2023 est.)
Real GDP per capita 2024:
$11,700 (2024 est.)
Remittances
$8.49 billion
Note:
<b>note:</b> personal transfers and compensation between resident and non-resident individuals/households/entities
Remittances 2022:
24.6% of GDP (2022 est.)
Remittances 2023:
24.5% of GDP (2023 est.)
Remittances 2024:
24% of GDP (2024 est.)
Reserves of foreign exchange and gold
$3.7 billion
Note:
<b>note:</b> holdings of gold (year-end prices)/foreign exchange/special drawing rights in current dollars
Reserves of foreign exchange and gold 2022:
$2.695 billion (2022 est.)
Reserves of foreign exchange and gold 2023:
$3.079 billion (2023 est.)
Reserves of foreign exchange and gold 2024:
$3.705 billion (2024 est.)
Revenue (excl grants)
27 % of GDP
Tax revenue
21 % of GDP
Taxes and other revenues
20.7% (of GDP) (2023 est.)
note:
<b>note:</b> central government tax revenue as a % of GDP
Unemployment rate
3.3%
Note:
<b>note:</b> % of labor force seeking employment
Unemployment rate 2022:
3% (2022 est.)
Unemployment rate 2023:
3% (2023 est.)
Unemployment rate 2024:
2.9% (2024 est.)
Youth unemployment rate (ages 15-24)
Female:
9.5% (2024 est.)
Male:
5.2% (2024 est.)
Note:
<b>note:</b> % of labor force ages 15-24 seeking employment
Total:
6.7% (2024 est.)
World Bank Indicators
Currency
euro (EUR) (2025)
Gini Index
34.70 (2018)
Languages
Spanish, Catalan, Basque, Galician (2025)
Economic Rankings
External Debt
#45
Gini Index
#68
Imports
#99
GDP (Nominal)
#104
GDP (PPP)
#105
Exports
#112
Reserves
#114
GDP per Capita
#117
Inflation Rate
#120
Unemployment Rate
#140
GDP Growth Rate
#142
Quick Facts
Industries
food processing, beverages, petroleum, chemicals, fertilizer, textiles, furniture, light metals
Agricultural products
sugarcane, maize, milk, chicken, sorghum, beans, oranges, coconuts, eggs, mangoes/guavas (2023)
Labor force
2.89 million (2024 est.)
Exports - partners
USA 36%, Guatemala 17%, Honduras 15%, Nicaragua 8%, Costa Rica 5% (2023)
Imports - partners
USA 28%, China 15%, Guatemala 11%, Mexico 8%, Honduras 5% (2023)
Exchange rates
the US dollar is used as a medium of exchange and circulates freely in the economy
Explore More
Our Partners
Trusted partner applications powering global data and insights