Countries
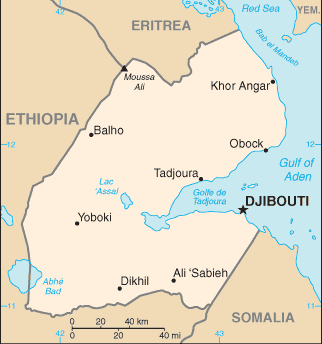
Djibouti

Key Economic Indicators
$9.13 billion
$7,810
6.98%
2.08%
26.02%
$4.086 billion (2024 est.)
33.7% of GDP (2016 est.)
$610.12 million
Economic Overview
food import-dependent Horn of Africa economy driven by various national military bases and port-based trade; fairly resilient from COVID-19 disruptions; major re-exporter; increasing Ethiopian and Chinese trade relations; investing in infrastructure
All Economic Data
Agricultural products
vegetables, beans, milk, beef, camel milk, lemons/limes, goat meat, lamb/mutton, tomatoes, beef offal (2023)
note:
<b>note:</b> top ten agricultural products based on tonnage
Budget
Expenditures:
$754 million (2019 est.)
Revenues:
$725 million (2019 est.)
Currency
code:
DJF
name:
Djiboutian franc (DJF) [Fr]
Current account balance
$610.12 million
Current account balance 2022:
$656.207 million (2022 est.)
Current account balance 2023:
$721.349 million (2023 est.)
Current account balance 2024:
$610.124 million (2024 est.)
Note:
<b>note:</b> balance of payments - net trade and primary/secondary income in current dollars
Debt - external
$3.46 billion
Debt - external 2023:
$2.531 billion (2023 est.)
Note:
<b>note:</b> present value of external debt in current US dollars
Exchange rates
Currency:
Djiboutian francs (DJF) per US dollar -
Exchange rates 2020:
177.721 (2020 est.)
Exchange rates 2021:
177.721 (2021 est.)
Exchange rates 2022:
177.721 (2022 est.)
Exchange rates 2023:
177.721 (2023 est.)
Exchange rates 2024:
177.721 (2024 est.)
Exports
$5.25 billion
Exports 2022:
$5.674 billion (2022 est.)
Exports 2023:
$5.877 billion (2023 est.)
Exports 2024:
$5.25 billion (2024 est.)
Note:
<b>note:</b> balance of payments - exports of goods and services in current dollars
Exports - commodities
raw sugar, seed oils, cars, palm oil, rice (2023)
note:
<b>note:</b> top five export commodities based on value in dollars
Exports - partners
Ethiopia 77%, UAE 5%, China 3%, Singapore 2%, France 2% (2023)
note:
<b>note:</b> top five export partners based on percentage share of exports
Foreign direct investment
net inflows:
$67.82 million
GDP - composition, by end use
Exports of goods and services:
160.8% (2024 est.)
Government consumption:
18.8% (2024 est.)
Household consumption:
73% (2024 est.)
Imports of goods and services:
-148.3% (2024 est.)
Investment in fixed capital:
26.3% (2024 est.)
Investment in inventories:
-30.1% (2024 est.)
Note:
<strong>note:</strong> figures may not total 100% due to rounding or gaps in data collection
GDP - composition, by sector of origin
Agriculture:
2.6% (2024 est.)
Industry:
15.4% (2024 est.)
Note:
<b>note:</b> figures may not total 100% due to non-allocated consumption not captured in sector-reported data
Services:
75.5% (2024 est.)
GDP (official exchange rate)
$4.086 billion (2024 est.)
note:
<b>note:</b> data in current dollars at official exchange rate
GDP per capita (nominal)
$3,553
Gini Index coefficient - distribution of family income
41.6 (2017)
Gini Index coefficient - distribution of family income 2017:
41.6 (2017 est.)
Note:
<b>note:</b> index (0-100) of income distribution; higher values represent greater inequality
GNI (gross national income)
$4.27 billion
GNI per capita
$3,640
Gross domestic investment
0 % of GDP
Household income or consumption by percentage share
Highest 10%:
32.3% (2017 est.)
Lowest 10%:
1.9% (2017 est.)
Note:
<b>note:</b> % share of income accruing to lowest and highest 10% of population
Imports
$4.77 billion
Imports 2022:
$5.096 billion (2022 est.)
Imports 2023:
$5.269 billion (2023 est.)
Imports 2024:
$4.765 billion (2024 est.)
Note:
<b>note:</b> balance of payments - imports of goods and services in current dollars
Imports - commodities
refined petroleum, palm oil, fertilizers, cars, seed oils (2023)
note:
<b>note:</b> top five import commodities based on value in dollars
Imports - partners
China 32%, India 12%, UAE 10%, Turkey 6%, Morocco 5% (2023)
note:
<b>note:</b> top five import partners based on percentage share of imports
Industrial production growth rate
9.7% (2024 est.)
note:
<b>note:</b> annual % change in industrial value added based on constant local currency
Industries
construction, agricultural processing, shipping
Inflation rate (consumer prices)
2.08%
Inflation rate (consumer prices) 2022:
5.2% (2022 est.)
Inflation rate (consumer prices) 2023:
1.5% (2023 est.)
Inflation rate (consumer prices) 2024:
2.1% (2024 est.)
Note:
<b>note:</b> annual % change based on consumer prices
Labor force
265,200 (2024 est.)
note:
<b>note:</b> number of people ages 15 or older who are employed or seeking work
total:
267,610 persons
Labor force - by occupation
agriculture:
1.15%
industry:
6.68%
services:
92.17%
Population below poverty line
21.1% (2017 est.)
note:
<b>note:</b> % of population with income below national poverty line
Public debt
Public debt 2016:
33.7% of GDP (2016 est.)
Real GDP (purchasing power parity)
$9.13 billion
Note:
<b>note:</b> data in 2021 dollars
Real GDP (purchasing power parity) 2022:
$7.028 billion (2022 est.)
Real GDP (purchasing power parity) 2023:
$7.546 billion (2023 est.)
Real GDP (purchasing power parity) 2024:
$7.995 billion (2024 est.)
Real GDP growth rate
6.98%
Note:
<b>note:</b> annual GDP % growth based on constant local currency
Real GDP growth rate 2022:
5.2% (2022 est.)
Real GDP growth rate 2023:
7.4% (2023 est.)
Real GDP growth rate 2024:
6% (2024 est.)
Real GDP per capita
$7,810
Note:
<b>note:</b> data in 2021 dollars
Real GDP per capita 2022:
$6,200 (2022 est.)
Real GDP per capita 2023:
$6,500 (2023 est.)
Real GDP per capita 2024:
$6,800 (2024 est.)
Remittances
$56 million
Note:
<b>note:</b> personal transfers and compensation between resident and non-resident individuals/households/entities
Remittances 2022:
1.6% of GDP (2022 est.)
Remittances 2023:
1.5% of GDP (2023 est.)
Remittances 2024:
1.4% of GDP (2024 est.)
Reserves of foreign exchange and gold
$348.73 million
Note:
<b>note:</b> holdings of gold (year-end prices)/foreign exchange/special drawing rights in current dollars
Reserves of foreign exchange and gold 2022:
$589.437 million (2022 est.)
Reserves of foreign exchange and gold 2023:
$502.034 million (2023 est.)
Reserves of foreign exchange and gold 2024:
$348.725 million (2024 est.)
Unemployment rate
26.02%
Note:
<b>note:</b> % of labor force seeking employment
Unemployment rate 2022:
26.4% (2022 est.)
Unemployment rate 2023:
26.2% (2023 est.)
Unemployment rate 2024:
25.9% (2024 est.)
Youth unemployment rate (ages 15-24)
Female:
77.9% (2024 est.)
Male:
75.3% (2024 est.)
Note:
<b>note:</b> % of labor force ages 15-24 seeking employment
Total:
76.3% (2024 est.)
World Bank Indicators
Broad Money
71.07 (2024)
Currency
Djiboutian franc (DJF) Fr (2025)
Current Account Balance (US$)
$610.12M (2024)
Exchange Rate
178 (2024)
Exports (US$)
$5.25B (2024)
External Debt
$3.46B (2024)
FDI Net Inflows (US$)
1.63 (2024)
GDP Growth (%)
6.98 (2024)
Gdp Nominal
$4.15B (2024)
GDP Per Capita
3,553 (2024)
GDP (Current US$)
$4.15B (2024)
Gini Index
41.60 (2017)
Imports (US$)
$4.77B (2024)
Inflation Rate (%)
2.11 (2024)
Inflation Rate
2.11 (2024)
Languages
Arabic, French (2025)
Population
$1.17M (2024)
Reserves
$348.73M (2024)
Trade Pct Gdp
241 (2024)
Unemployment Rate (%)
26.02 (2025)
Unemployment Rate
26.01 (2024)
Youth Unemployment
76.77 (2025)
Economic Rankings
Unemployment Rate
#3
GDP Growth Rate
#40
Gini Index
#55
External Debt
#94
Exports
#135
GDP per Capita
#139
Imports
#150
Reserves
#155
Inflation Rate
#160
GDP (Nominal)
#163
GDP (PPP)
#164
Quick Facts
Industries
construction, agricultural processing, shipping
Agricultural products
vegetables, beans, milk, beef, camel milk, lemons/limes, goat meat, lamb/mutton, tomatoes, beef offal (2023)
Labor force
265,200 (2024 est.)
Exports - partners
Ethiopia 77%, UAE 5%, China 3%, Singapore 2%, France 2% (2023)
Imports - partners
China 32%, India 12%, UAE 10%, Turkey 6%, Morocco 5% (2023)
Exchange rates
Djiboutian francs (DJF) per US dollar -
Explore More
Our Partners
Trusted partner applications powering global data and insights