Countries
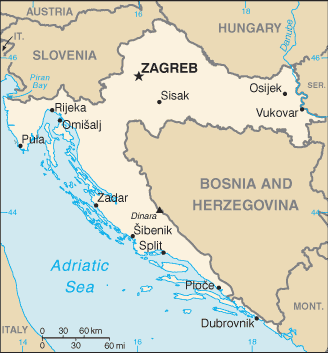
Croatia

Key Economic Indicators
$191.57 billion
$49,551
3.83%
2.97%
5%
$92.526 billion (2024 est.)
<b>note:</b> central government debt as a % of GDP
$-1,049,215,175
Economic Overview
<p>upper-middle-income Balkan economy; newest euro user (introduced in 2023); increased investments from EU structural funds and tourism sector contributing to strong but moderating economic growth; declining energy prices and restrictive monetary policy easing inflation; historically low unemployment rate with labor shortages within services and manufacturing sectors</p>
All Economic Data
Agricultural products
maize, wheat, sugar beets, milk, barley, soybeans, sunflower seeds, potatoes, pork, grapes (2023)
note:
<b>note:</b> top ten agricultural products based on tonnage
Average household expenditures
On alcohol and tobacco:
7.9% of household expenditures (2023 est.)
On food:
18.5% of household expenditures (2023 est.)
Budget
Expenditures:
$33.715 billion (2023 est.)
Note:
<b>note:</b> central government revenues (excluding grants) and expenditures converted to US dollars at average official exchange rate for year indicated
Revenues:
$32.487 billion (2023 est.)
Currency
code:
EUR
name:
euro (EUR) [€]
Current account balance
$-1,049,215,175
Current account balance 2022:
-$2.621 billion (2022 est.)
Current account balance 2023:
$635.97 million (2023 est.)
Current account balance 2024:
-$1.049 billion (2024 est.)
Note:
<b>note:</b> balance of payments - net trade and primary/secondary income in current dollars
Exchange rates
Currency:
euros (EUR) per US dollar -
Exchange rates 2020:
0.876 (2020 est.)
Exchange rates 2021:
0.845 (2021 est.)
Exchange rates 2022:
0.95 (2022 est.)
Exchange rates 2023:
0.925 (2023 est.)
Exchange rates 2024:
0.924 (2024 est.)
Note:
<strong>note:</strong> Croatia used the kuna prior to conversion to the euro on 1 January 2023. During the transition period the exchange rate was fixed at 7.53450 kuna to 1 euro.
Exports
$46.62 billion
Exports 2022:
$41.907 billion (2022 est.)
Exports 2023:
$45.064 billion (2023 est.)
Exports 2024:
$46.601 billion (2024 est.)
Note:
<b>note:</b> balance of payments - exports of goods and services in current dollars
Exports - commodities
ships, garments, electricity, packaged medicine, wood (2023)
note:
<b>note:</b> top five export commodities based on value in dollars
Exports - partners
Italy 14%, Germany 11%, Slovenia 11%, Bosnia & Herzegovina 6%, Austria 6% (2023)
note:
<b>note:</b> top five export partners based on percentage share of exports
Foreign direct investment
net inflows:
$4.54 billion
GDP - composition, by end use
Exports of goods and services:
49.8% (2024 est.)
Government consumption:
22.6% (2024 est.)
Household consumption:
57% (2024 est.)
Imports of goods and services:
-52.9% (2024 est.)
Investment in fixed capital:
23.7% (2024 est.)
Investment in inventories:
-0.2% (2024 est.)
Note:
<b>note:</b> figures may not total 100% due to rounding or gaps in data collection
GDP - composition, by sector of origin
Agriculture:
3.4% (2024 est.)
Industry:
19.8% (2024 est.)
Note:
<b>note:</b> figures may not total 100% due to non-allocated consumption not captured in sector-reported data
Services:
59.7% (2024 est.)
GDP (official exchange rate)
$92.526 billion (2024 est.)
note:
<b>note:</b> data in current dollars at official exchange rate
GDP per capita (nominal)
$24,050
Gini Index coefficient - distribution of family income
29.7 (2018)
Gini Index coefficient - distribution of family income 2022:
30 (2022 est.)
Note:
<b>note:</b> index (0-100) of income distribution; higher values represent greater inequality
GNI (gross national income)
$93.33 billion
GNI per capita
$22,250
Gross domestic investment
24 % of GDP
Household income or consumption by percentage share
Highest 10%:
23% (2022 est.)
Lowest 10%:
2.9% (2022 est.)
Note:
<b>note:</b> % share of income accruing to lowest and highest 10% of population
Imports
$50.93 billion
Imports 2022:
$46.769 billion (2022 est.)
Imports 2023:
$46.811 billion (2023 est.)
Imports 2024:
$49.86 billion (2024 est.)
Note:
<b>note:</b> balance of payments - imports of goods and services in current dollars
Imports - commodities
refined petroleum, cars, garments, natural gas, crude petroleum (2023)
note:
<b>note:</b> top five import commodities based on value in dollars
Imports - partners
Italy 14%, Germany 14%, Slovenia 11%, Hungary 6%, Austria 5% (2023)
note:
<b>note:</b> top five import partners based on percentage share of imports
Industrial production growth rate
2.1% (2024 est.)
note:
<b>note:</b> annual % change in industrial value added based on constant local currency
Industries
chemicals and plastics, machine tools, fabricated metal, electronics, pig iron and rolled steel products, aluminum, paper, wood products, construction materials, textiles, shipbuilding, petroleum and petroleum refining, food and beverages, tourism
Inflation rate (consumer prices)
2.97%
Inflation rate (consumer prices) 2022:
10.8% (2022 est.)
Inflation rate (consumer prices) 2023:
7.9% (2023 est.)
Inflation rate (consumer prices) 2024:
3% (2024 est.)
Note:
<b>note:</b> annual % change based on consumer prices
Labor force
1.733 million (2024 est.)
note:
<b>note:</b> number of people ages 15 or older who are employed or seeking work
total:
1.73 million persons
Labor force - by occupation
agriculture:
4.33%
industry:
26.36%
services:
69.31%
Population below poverty line
18% (2021 est.)
note:
<b>note:</b> % of population with income below national poverty line
Public debt
Note:
<b>note:</b> central government debt as a % of GDP
Public debt 2023:
75.6% of GDP (2023 est.)
Real GDP (purchasing power parity)
$191.57 billion
Note:
<b>note:</b> data in 2021 dollars
Real GDP (purchasing power parity) 2022:
$153.693 billion (2022 est.)
Real GDP (purchasing power parity) 2023:
$158.769 billion (2023 est.)
Real GDP (purchasing power parity) 2024:
$164.825 billion (2024 est.)
Real GDP growth rate
3.83%
Note:
<b>note:</b> annual GDP % growth based on constant local currency
Real GDP growth rate 2022:
7.3% (2022 est.)
Real GDP growth rate 2023:
3.3% (2023 est.)
Real GDP growth rate 2024:
3.8% (2024 est.)
Real GDP per capita
$49,551
Note:
<b>note:</b> data in 2021 dollars
Real GDP per capita 2022:
$39,900 (2022 est.)
Real GDP per capita 2023:
$41,100 (2023 est.)
Real GDP per capita 2024:
$42,600 (2024 est.)
Remittances
$6.7 billion
Note:
<b>note:</b> personal transfers and compensation between resident and non-resident individuals/households/entities
Remittances 2022:
7.5% of GDP (2022 est.)
Remittances 2023:
7.2% of GDP (2023 est.)
Remittances 2024:
7.3% of GDP (2024 est.)
Reserves of foreign exchange and gold
$3.34 billion
Note:
<b>note:</b> holdings of gold (year-end prices)/foreign exchange/special drawing rights in current dollars
Reserves of foreign exchange and gold 2022:
$29.726 billion (2022 est.)
Reserves of foreign exchange and gold 2023:
$3.176 billion (2023 est.)
Reserves of foreign exchange and gold 2024:
$3.336 billion (2024 est.)
Revenue (excl grants)
35 % of GDP
Tax revenue
21 % of GDP
Taxes and other revenues
21.5% (of GDP) (2023 est.)
note:
<b>note:</b> central government tax revenue as a % of GDP
Unemployment rate
5%
Note:
<b>note:</b> % of labor force seeking employment
Unemployment rate 2022:
7% (2022 est.)
Unemployment rate 2023:
6.1% (2023 est.)
Unemployment rate 2024:
5.3% (2024 est.)
Youth unemployment rate (ages 15-24)
Female:
18.2% (2024 est.)
Male:
15.5% (2024 est.)
Note:
<b>note:</b> % of labor force ages 15-24 seeking employment
Total:
16.6% (2024 est.)
World Bank Indicators
Currency
euro (EUR) (2025)
Exports (US$)
$46.62B (2024)
FDI Net Inflows (US$)
$4.54B (2024)
GDP Growth (%)
3.83 (2024)
Gdp Nominal
$92.98B (2024)
GDP Per Capita
24,050 (2024)
Gini Index
29.70 (2018)
Imports (US$)
$50.93B (2024)
Inflation Rate (%)
2.97 (2024)
Languages
Croatian (2025)
Reserves
$3.34B (2024)
Unemployment Rate (%)
5.00 (2024)
Youth Unemployment
16.48 (2024)
Economic Rankings
GDP Growth Rate
#43
GDP per Capita
#44
Reserves
#58
Inflation Rate
#64
Imports
#66
Unemployment Rate
#67
Exports
#69
GDP (Nominal)
#73
GDP (PPP)
#79
Gini Index
#153
Quick Facts
Industries
chemicals and plastics, machine tools, fabricated metal, electronics, pig iron and rolled steel products, aluminum, paper, wood products, construction materials, textiles, shipbuilding, petroleum and
Agricultural products
maize, wheat, sugar beets, milk, barley, soybeans, sunflower seeds, potatoes, pork, grapes (2023)
Labor force
1.733 million (2024 est.)
Exports - partners
Italy 14%, Germany 11%, Slovenia 11%, Bosnia & Herzegovina 6%, Austria 6% (2023)
Imports - partners
Italy 14%, Germany 14%, Slovenia 11%, Hungary 6%, Austria 5% (2023)
Exchange rates
euros (EUR) per US dollar -
Explore More
Our Partners
Trusted partner applications powering global data and insights