Countries
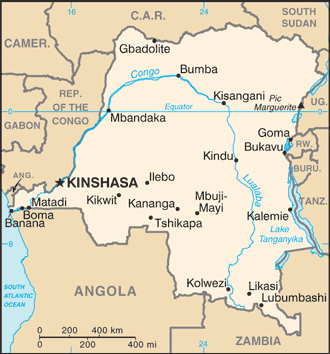
Congo DR

Key Economic Indicators
$199 billion
$1,821
6.13%
0.7% (2015 est.)
4.43%
$70.749 billion (2024 est.)
15 % of GDP
$-2,719,446,524
Economic Overview
very poor, large, natural resource-rich sub-Saharan country; possesses the world’s second largest rainforest; increasing Chinese extractive sector trade; massive decrease in government investments; increasing current account deficit and public debts
All Economic Data
Agricultural products
cassava, plantains, sugarcane, maize, oil palm fruit, rice, root vegetables, bananas, sweet potatoes, groundnuts (2023)
note:
<b>note:</b> top ten agricultural products based on tonnage
Budget
Expenditures:
$13.026 billion (2022 est.)
Note:
<b>note:</b> central government revenues and expenses (excluding grants/extrabudgetary units/social security funds) converted to US dollars at average official exchange rate for year indicated
Revenues:
$11.568 billion (2022 est.)
Currency
code:
CDF
name:
Congolese franc (CDF) [FC]
Current account balance
$-2,719,446,524
Current account balance 2021:
-$587.407 million (2021 est.)
Current account balance 2022:
-$3.148 billion (2022 est.)
Current account balance 2023:
-$3.883 billion (2023 est.)
Note:
<b>note:</b> balance of payments - net trade and primary/secondary income in current dollars
Debt - external
$12.48 billion
Debt - external 2023:
$7.926 billion (2023 est.)
Note:
<b>note:</b> present value of external debt in current US dollars
Exchange rates
Currency:
Congolese francs (CDF) per US dollar -
Exchange rates 2019:
1,647.76 (2019 est.)
Exchange rates 2020:
1,851.122 (2020 est.)
Exchange rates 2021:
1,989.391 (2021 est.)
Exchange rates 2022:
2,006.708 (2022 est.)
Exchange rates 2023:
2,340.036 (2023 est.)
Exports
$34.6 billion
Exports 2021:
$22.354 billion (2021 est.)
Exports 2022:
$28.753 billion (2022 est.)
Exports 2023:
$29.65 billion (2023 est.)
Note:
<b>note:</b> balance of payments - exports of goods and services in current dollars
Exports - commodities
refined copper, cobalt, copper ore, raw copper, crude petroleum (2023)
note:
<b>note:</b> top five export commodities based on value in dollars
Exports - partners
China 69%, UAE 7%, India 3%, Spain 3%, Egypt 3% (2023)
note:
<b>note:</b> top five export partners based on percentage share of exports
Foreign direct investment
net inflows:
$2.92 billion
GDP - composition, by end use
Exports of goods and services:
46.6% (2024 est.)
Government consumption:
8.1% (2024 est.)
Household consumption:
62.7% (2024 est.)
Imports of goods and services:
-50.9% (2024 est.)
Investment in fixed capital:
32.9% (2024 est.)
Investment in inventories:
0.5% (2024 est.)
Note:
<b>note:</b> figures may not total 100% due to rounding or gaps in data collection
GDP - composition, by sector of origin
Agriculture:
17.1% (2024 est.)
Industry:
46.6% (2024 est.)
Note:
<b>note:</b> figures may not total 100% due to non-allocated consumption not captured in sector-reported data
Services:
33% (2024 est.)
GDP (official exchange rate)
$70.749 billion (2024 est.)
note:
<b>note:</b> data in current dollars at official exchange rate
GDP per capita (nominal)
$649
Gini Index coefficient - distribution of family income
42.1 (2012)
Gini Index coefficient - distribution of family income 2020:
44.7 (2020 est.)
Note:
<strong>note:</strong> index (0-100) of income distribution; higher values represent greater inequality
GNI (gross national income)
$68.61 billion
GNI per capita
$670
Gross domestic investment
33 % of GDP
Household income or consumption by percentage share
Highest 10%:
35.7% (2020 est.)
Lowest 10%:
2.1% (2020 est.)
Note:
<strong>note:</strong> % share of income accruing to lowest and highest 10% of population
Imports
$36.76 billion
Imports 2021:
$22.193 billion (2021 est.)
Imports 2022:
$31.699 billion (2022 est.)
Imports 2023:
$33.68 billion (2023 est.)
Note:
<b>note:</b> balance of payments - imports of goods and services in current dollars
Imports - commodities
trucks, refined petroleum, stone processing machines, plastic products, sulphur (2023)
note:
<b>note:</b> top five import commodities based on value in dollars
Imports - partners
China 35%, Zambia 12%, South Africa 12%, India 5%, Belgium 4% (2023)
note:
<b>note:</b> top five import partners based on percentage share of imports
Industrial production growth rate
10.1% (2024 est.)
note:
<b>note:</b> annual % change in industrial value added based on constant local currency
Industries
mining (copper, cobalt, gold, diamonds, coltan, zinc, tin, tungsten), mineral processing, consumer products (textiles, plastics, footwear, cigarettes), metal products, processed foods and beverages, timber, cement, commercial ship repair
Inflation rate (consumer prices)
Inflation rate (consumer prices) 2015:
0.7% (2015 est.)
Inflation rate (consumer prices) 2016:
2.9% (2016 est.)
Inflation rate (consumer prices) 2017:
41.5% (2017 est.)
Note:
<b>note:</b> annual % change based on consumer prices
Labor force
38.546 million (2024 est.)
note:
<b>note:</b> number of people ages 15 or older who are employed or seeking work
total:
39.22 million persons
Labor force - by occupation
agriculture:
58.52%
industry:
8.02%
services:
33.45%
Population below poverty line
56.2% (2020 est.)
note:
<strong>note:</strong> % of population with income below national poverty line
Public debt
15 % of GDP
Note:
<strong>note:</strong> central government debt as a % of GDP
Public debt 2022:
16% of GDP (2022 est.)
Real GDP (purchasing power parity)
$199 billion
Note:
<b>note:</b> data in 2021 dollars
Real GDP (purchasing power parity) 2022:
$141.867 billion (2022 est.)
Real GDP (purchasing power parity) 2023:
$154.081 billion (2023 est.)
Real GDP (purchasing power parity) 2024:
$164.367 billion (2024 est.)
Real GDP growth rate
6.13%
Note:
<b>note:</b> annual GDP % growth based on constant local currency
Real GDP growth rate 2022:
8.9% (2022 est.)
Real GDP growth rate 2023:
8.6% (2023 est.)
Real GDP growth rate 2024:
6.7% (2024 est.)
Real GDP per capita
$1,821
Note:
<b>note:</b> data in 2021 dollars
Real GDP per capita 2022:
$1,400 (2022 est.)
Real GDP per capita 2023:
$1,500 (2023 est.)
Real GDP per capita 2024:
$1,500 (2024 est.)
Remittances
$2 billion
Note:
<b>note:</b> personal transfers and compensation between resident and non-resident individuals/households/entities
Remittances 2021:
2.4% of GDP (2021 est.)
Remittances 2022:
5% of GDP (2022 est.)
Remittances 2023:
4.9% of GDP (2023 est.)
Reserves of foreign exchange and gold
$5.1 billion
Note:
<b>note:</b> holdings of gold (year-end prices)/foreign exchange/special drawing rights in current dollars
Reserves of foreign exchange and gold 2021:
$3.467 billion (2021 est.)
Reserves of foreign exchange and gold 2022:
$4.378 billion (2022 est.)
Reserves of foreign exchange and gold 2023:
$5.104 billion (2023 est.)
Revenue (excl grants)
13 % of GDP
Tax revenue
11 % of GDP
Taxes and other revenues
11.4% (of GDP) (2022 est.)
note:
<strong>note:</strong> central government tax revenue as a % of GDP
Unemployment rate
4.43%
Note:
<b>note:</b> % of labor force seeking employment
Unemployment rate 2022:
4.6% (2022 est.)
Unemployment rate 2023:
4.5% (2023 est.)
Unemployment rate 2024:
4.6% (2024 est.)
Youth unemployment rate (ages 15-24)
Female:
6.6% (2024 est.)
Male:
10.8% (2024 est.)
Note:
<b>note:</b> % of labor force ages 15-24 seeking employment
Total:
8.5% (2024 est.)
World Bank Indicators
Currency
Central African CFA franc (XAF) Fr (2025)
Exports (US$)
$8.30B (2024)
External Debt
$6.73B (2024)
FDI Net Inflows (US$)
$603.62M (2024)
GDP Growth (%)
2.58 (2024)
Gdp Nominal
$15.72B (2024)
GDP Per Capita
2,482 (2024)
Gini Index
48.90 (2011)
Imports (US$)
$6.35B (2024)
Inflation Rate (%)
3.09 (2024)
Languages
French, Kikongo, Lingala (2025)
Reserves
$715.39M (2023)
Unemployment Rate (%)
19.90 (2024)
Youth Unemployment
40.58 (2024)
Economic Rankings
Inflation Rate
#15
GDP Growth Rate
#29
Gini Index
#36
External Debt
#65
Imports
#70
Exports
#77
GDP (PPP)
#78
GDP (Nominal)
#86
Reserves
#101
Unemployment Rate
#117
GDP per Capita
#189
Quick Facts
Industries
mining (copper, cobalt, gold, diamonds, coltan, zinc, tin, tungsten), mineral processing, consumer products (textiles, plastics, footwear, cigarettes), metal products, processed foods and beverages, t
Agricultural products
cassava, plantains, sugarcane, maize, oil palm fruit, rice, root vegetables, bananas, sweet potatoes, groundnuts (2023)
Labor force
38.546 million (2024 est.)
Exports - partners
China 69%, UAE 7%, India 3%, Spain 3%, Egypt 3% (2023)
Imports - partners
China 35%, Zambia 12%, South Africa 12%, India 5%, Belgium 4% (2023)
Exchange rates
Congolese francs (CDF) per US dollar -
Explore More
Our Partners
Trusted partner applications powering global data and insights