Countries
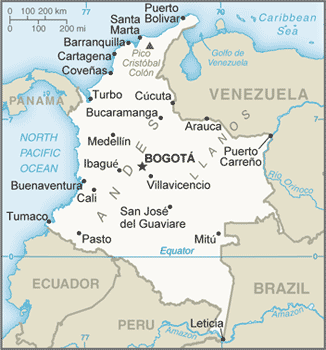
Colombia

Key Economic Indicators
$1.18 trillion
$22,349
1.6%
6.61%
8.29%
$418.542 billion (2024 est.)
71 % of GDP
$-6,880,114,731
Economic Overview
prior to COVID-19, one of the most consistent growth economies; declining poverty; large stimulus package has mitigated economic fallout, but delayed key infrastructure investments; successful inflation management; sound flexible exchange rate regime; domestic economy suffers from lack of trade integration and infrastructure
All Economic Data
Agricultural products
sugarcane, oil palm fruit, milk, rice, plantains, potatoes, bananas, maize, chicken, avocados (2023)
note:
<b>note:</b> top ten agricultural products based on tonnage
Average household expenditures
On alcohol and tobacco:
3.6% of household expenditures (2023 est.)
On food:
20.6% of household expenditures (2023 est.)
Budget
Expenditures:
$123.966 billion (2023 est.)
Note:
<b>note:</b> central government revenues (excluding grants) and expenditures converted to US dollars at average official exchange rate for year indicated
Revenues:
$116.49 billion (2023 est.)
Currency
code:
COP
name:
Colombian peso (COP) [$]
Current account balance
$-6,880,114,731
Current account balance 2022:
-$20.879 billion (2022 est.)
Current account balance 2023:
-$8.285 billion (2023 est.)
Current account balance 2024:
-$7.412 billion (2024 est.)
Note:
<b>note:</b> balance of payments - net trade and primary/secondary income in current dollars
Debt - external
$201.76 billion
Debt - external 2023:
$108.027 billion (2023 est.)
Note:
<b>note:</b> present value of external debt in current US dollars
Exchange rates
Currency:
Colombian pesos (COP) per US dollar -
Exchange rates 2020:
3,693.276 (2020 est.)
Exchange rates 2021:
3,744.244 (2021 est.)
Exchange rates 2022:
4,256.194 (2022 est.)
Exchange rates 2023:
4,325.955 (2023 est.)
Exchange rates 2024:
4,074.434 (2024 est.)
Exports
$67.43 billion
Exports 2022:
$73.514 billion (2022 est.)
Exports 2023:
$68.674 billion (2023 est.)
Exports 2024:
$68.866 billion (2024 est.)
Note:
<b>note:</b> balance of payments - exports of goods and services in current dollars
Exports - commodities
crude petroleum, coal, gold, coffee, refined petroleum (2023)
note:
<b>note:</b> top five export commodities based on value in dollars
Exports - partners
USA 27%, Panama 9%, India 5%, China 5%, Netherlands 4% (2023)
note:
<b>note:</b> top five export partners based on percentage share of exports
Foreign direct investment
net inflows:
$13.68 billion
GDP - composition, by end use
Exports of goods and services:
16% (2024 est.)
Government consumption:
14.7% (2024 est.)
Household consumption:
73.1% (2024 est.)
Imports of goods and services:
-20.9% (2024 est.)
Investment in fixed capital:
16.5% (2024 est.)
Investment in inventories:
0.6% (2024 est.)
Note:
<b>note:</b> figures may not total 100% due to rounding or gaps in data collection
GDP - composition, by sector of origin
Agriculture:
9.3% (2024 est.)
Industry:
23.1% (2024 est.)
Note:
<b>note:</b> figures may not total 100% due to non-allocated consumption not captured in sector-reported data
Services:
58.2% (2024 est.)
GDP (official exchange rate)
$418.542 billion (2024 est.)
note:
<b>note:</b> data in current dollars at official exchange rate
GDP per capita (nominal)
$7,919
Gini Index coefficient - distribution of family income
51.3 (2019)
Gini Index coefficient - distribution of family income 2023:
53.9 (2023 est.)
Note:
<b>note:</b> index (0-100) of income distribution; higher values represent greater inequality
GNI (gross national income)
$410.21 billion
GNI per capita
$7,040
Gross domestic investment
17 % of GDP
Household income or consumption by percentage share
Highest 10%:
42.7% (2023 est.)
Lowest 10%:
1.1% (2023 est.)
Note:
<b>note:</b> % share of income accruing to lowest and highest 10% of population
Imports
$87.64 billion
Imports 2022:
$89.608 billion (2022 est.)
Imports 2023:
$76.449 billion (2023 est.)
Imports 2024:
$78.633 billion (2024 est.)
Note:
<b>note:</b> balance of payments - imports of goods and services in current dollars
Imports - commodities
refined petroleum, cars, broadcasting equipment, aircraft, packaged medicine (2023)
note:
<b>note:</b> top five import commodities based on value in dollars
Imports - partners
USA 26%, China 22%, Brazil 6%, Mexico 5%, Germany 4% (2023)
note:
<b>note:</b> top five import partners based on percentage share of imports
Industrial production growth rate
-1.3% (2024 est.)
note:
<b>note:</b> annual % change in industrial value added based on constant local currency
Industries
textiles, food processing, oil, clothing and footwear, beverages, chemicals, cement; gold, coal, emeralds
Inflation rate (consumer prices)
6.61%
Inflation rate (consumer prices) 2022:
10.2% (2022 est.)
Inflation rate (consumer prices) 2023:
11.7% (2023 est.)
Inflation rate (consumer prices) 2024:
6.6% (2024 est.)
Note:
<b>note:</b> annual % change based on consumer prices
Labor force
26.822 million (2024 est.)
note:
<b>note:</b> number of people ages 15 or older who are employed or seeking work
total:
27.1 million persons
Labor force - by occupation
agriculture:
14.16%
industry:
20%
services:
65.84%
Population below poverty line
33% (2023 est.)
note:
<b>note:</b> % of population with income below national poverty line
Public debt
71 % of GDP
Note:
<b>note:</b> central government debt as a % of GDP
Public debt 2023:
71.3% of GDP (2023 est.)
Real GDP (purchasing power parity)
$1.18 trillion
Note:
<b>note:</b> data in 2021 dollars
Real GDP (purchasing power parity) 2022:
$955.016 billion (2022 est.)
Real GDP (purchasing power parity) 2023:
$961.82 billion (2023 est.)
Real GDP (purchasing power parity) 2024:
$978.592 billion (2024 est.)
Real GDP growth rate
1.6%
Note:
<b>note:</b> annual GDP % growth based on constant local currency
Real GDP growth rate 2022:
7.3% (2022 est.)
Real GDP growth rate 2023:
0.7% (2023 est.)
Real GDP growth rate 2024:
1.7% (2024 est.)
Real GDP per capita
$22,349
Note:
<b>note:</b> data in 2021 dollars
Real GDP per capita 2022:
$18,500 (2022 est.)
Real GDP per capita 2023:
$18,400 (2023 est.)
Real GDP per capita 2024:
$18,500 (2024 est.)
Remittances
$11.87 billion
Note:
<b>note:</b> personal transfers and compensation between resident and non-resident individuals/households/entities
Remittances 2022:
2.7% of GDP (2022 est.)
Remittances 2023:
2.8% of GDP (2023 est.)
Remittances 2024:
2.8% of GDP (2024 est.)
Reserves of foreign exchange and gold
$61.9 billion
Note:
<b>note:</b> holdings of gold (year-end prices)/foreign exchange/special drawing rights in current dollars
Reserves of foreign exchange and gold 2022:
$56.704 billion (2022 est.)
Reserves of foreign exchange and gold 2023:
$59.041 billion (2023 est.)
Reserves of foreign exchange and gold 2024:
$61.898 billion (2024 est.)
Revenue (excl grants)
26 % of GDP
Tax revenue
15 % of GDP
Taxes and other revenues
17.6% (of GDP) (2023 est.)
note:
<b>note:</b> central government tax revenue as a % of GDP
Unemployment rate
8.29%
Note:
<b>note:</b> % of labor force seeking employment
Unemployment rate 2022:
10.6% (2022 est.)
Unemployment rate 2023:
9.6% (2023 est.)
Unemployment rate 2024:
9.7% (2024 est.)
Youth unemployment rate (ages 15-24)
Female:
24.3% (2024 est.)
Male:
16.5% (2024 est.)
Note:
<b>note:</b> % of labor force ages 15-24 seeking employment
Total:
19.8% (2024 est.)
World Bank Indicators
Currency
Colombian peso (COP) $ (2025)
Exports (US$)
$67.43B (2024)
External Debt
$201.76B (2024)
FDI Net Inflows (US$)
$13.68B (2024)
GDP Growth (%)
1.60 (2024)
Gdp Nominal
$418.82B (2024)
GDP Per Capita
7,919 (2024)
Gini Index
51.30 (2019)
Govt Debt Pct Gdp
71.48 (2024)
Imports (US$)
$87.64B (2024)
Inflation Rate (%)
6.61 (2024)
Languages
Spanish (2025)
Reserves
$61.90B (2024)
Unemployment Rate (%)
9.62 (2024)
Youth Unemployment
19.41 (2024)
Economic Rankings
External Debt
#9
Gini Index
#10
GDP (PPP)
#31
Reserves
#38
GDP (Nominal)
#38
Unemployment Rate
#41
GDP Growth Rate
#44
Imports
#51
Exports
#54
Inflation Rate
#55
GDP per Capita
#84
Quick Facts
Industries
textiles, food processing, oil, clothing and footwear, beverages, chemicals, cement; gold, coal, emeralds
Agricultural products
sugarcane, oil palm fruit, milk, rice, plantains, potatoes, bananas, maize, chicken, avocados (2023)
Labor force
26.822 million (2024 est.)
Exports - partners
USA 27%, Panama 9%, India 5%, China 5%, Netherlands 4% (2023)
Imports - partners
USA 26%, China 22%, Brazil 6%, Mexico 5%, Germany 4% (2023)
Exchange rates
Colombian pesos (COP) per US dollar -
Explore More
Our Partners
Trusted partner applications powering global data and insights