Countries
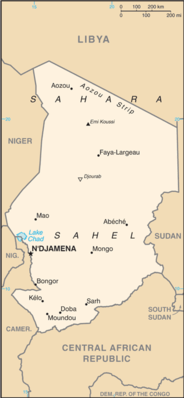
Chad

Key Economic Indicators
$55.67 billion
$2,743
4.2%
8.9%
1.06%
$20.626 billion (2024 est.)
52.4% of GDP (2016 est.)
Economic Overview
<p>oil-dependent economy challenged by market fluctuations, regional instability, refugee influx, and climate vulnerability; high levels of extreme poverty and food insecurity; recent growth driven by oil and agricultural recovery; debt-restructuring agreement under G20 Common Framework</p>
All Economic Data
Agricultural products
sorghum, groundnuts, millet, beef, cereals, yams, sugarcane, maize, cassava, milk (2023)
note:
<b>note:</b> top ten agricultural products based on tonnage
Budget
Expenditures:
$2.15 billion (2020 est.)
Note:
<b>note:</b> central government revenues and expenses (excluding grants/extrabudgetary units/social security funds) converted to US dollars at average official exchange rate for year indicated
Revenues:
$2.129 billion (2020 est.)
Currency
code:
XAF
name:
Central African CFA franc (XAF) [Fr]
Debt - external
$3.35 billion
Debt - external 2023:
$2.286 billion (2023 est.)
Note:
<b>note:</b> present value of external debt in current US dollars
Exchange rates
Currency:
Cooperation Financiere en Afrique Centrale francs (XAF) per US dollar -
Exchange rates 2020:
575.586 (2020 est.)
Exchange rates 2021:
554.531 (2021 est.)
Exchange rates 2022:
623.76 (2022 est.)
Exchange rates 2023:
606.57 (2023 est.)
Exchange rates 2024:
606.345 (2024 est.)
Exports
$5.81 billion
Exports 2022:
$5.658 billion (2022 est.)
Exports 2023:
$5.7 billion (2023 est.)
Exports 2024:
$5.799 billion (2024 est.)
Note:
<strong>note: </strong>GDP expenditure basis - exports of goods and services in current dollars
Exports - commodities
crude petroleum, gold, oil seeds, gum resins, cotton (2023)
note:
<b>note:</b> top five export commodities based on value in dollars
Exports - partners
UAE 26%, China 19%, Germany 17%, Netherlands 13%, France 10% (2023)
note:
<b>note:</b> top five export partners based on percentage share of exports
Foreign direct investment
net inflows:
$1.02 billion
GDP - composition, by end use
Exports of goods and services:
28.1% (2024 est.)
Government consumption:
8.7% (2024 est.)
Household consumption:
61.3% (2024 est.)
Imports of goods and services:
-17.2% (2024 est.)
Investment in fixed capital:
14.4% (2024 est.)
Investment in inventories:
3.4% (2024 est.)
Note:
<strong>note:</strong> figures may not total 100% due to rounding or gaps in data collection
GDP - composition, by sector of origin
Agriculture:
32.2% (2024 est.)
Industry:
29.7% (2024 est.)
Note:
<b>note:</b> figures may not total 100% due to non-allocated consumption not captured in sector-reported data
Services:
31.6% (2024 est.)
GDP (official exchange rate)
$20.626 billion (2024 est.)
note:
<b>note:</b> data in current dollars at official exchange rate
GDP per capita (nominal)
$962
Gini Index coefficient - distribution of family income
43.3 (2011)
Gini Index coefficient - distribution of family income 2022:
37.4 (2022 est.)
Note:
<b>note:</b> index (0-100) of income distribution; higher values represent greater inequality
GNI (gross national income)
$19.31 billion
GNI per capita
$940
Gross domestic investment
27 % of GDP
Household income or consumption by percentage share
Highest 10%:
29.5% (2022 est.)
Lowest 10%:
2.8% (2022 est.)
Note:
<b>note:</b> % share of income accruing to lowest and highest 10% of population
Imports
$3.53 billion
Imports 2022:
$2.898 billion (2022 est.)
Imports 2023:
$3.271 billion (2023 est.)
Imports 2024:
$3.557 billion (2024 est.)
Note:
<strong>note: </strong>GDP expenditure basis - imports of goods and services in current dollars
Imports - commodities
jewelry, broadcasting equipment, packaged medicine, cars, refined petroleum (2023)
note:
<strong>note:</strong> top five import commodities based on value in dollars
Imports - partners
China 28%, UAE 23%, Turkey 10%, France 9%, India 5% (2023)
note:
<b>note:</b> top five import partners based on percentage share of imports
Industrial production growth rate
5.1% (2024 est.)
note:
<b>note:</b> annual % change in industrial value added based on constant local currency
Industries
oil, cotton textiles, brewing, natron (sodium carbonate), soap, cigarettes, construction materials
Inflation rate (consumer prices)
8.9%
Inflation rate (consumer prices) 2022:
5.8% (2022 est.)
Inflation rate (consumer prices) 2023:
10.8% (2023 est.)
Inflation rate (consumer prices) 2024:
8.9% (2024 est.)
Note:
<b>note:</b> annual % change based on consumer prices
Labor force
6.6 million (2024 est.)
note:
<b>note:</b> number of people ages 15 or older who are employed or seeking work
total:
6.75 million persons
Labor force - by occupation
agriculture:
71.74%
industry:
8.5%
services:
19.76%
Population below poverty line
44.8% (2022 est.)
note:
<b>note:</b> % of population with income below national poverty line
Public debt
Public debt 2016:
52.4% of GDP (2016 est.)
Real GDP (purchasing power parity)
$55.67 billion
Note:
<b>note:</b> data in 2021 dollars
Real GDP (purchasing power parity) 2022:
$49.012 billion (2022 est.)
Real GDP (purchasing power parity) 2023:
$51.03 billion (2023 est.)
Real GDP (purchasing power parity) 2024:
$52.895 billion (2024 est.)
Real GDP growth rate
4.2%
Note:
<b>note:</b> annual GDP % growth based on constant local currency
Real GDP growth rate 2022:
12.9% (2022 est.)
Real GDP growth rate 2023:
4.1% (2023 est.)
Real GDP growth rate 2024:
3.7% (2024 est.)
Real GDP per capita
$2,743
Note:
<b>note:</b> data in 2021 dollars
Real GDP per capita 2022:
$2,700 (2022 est.)
Real GDP per capita 2023:
$2,600 (2023 est.)
Real GDP per capita 2024:
$2,600 (2024 est.)
Remittances
Note:
<strong>note:</strong> personal transfers and compensation between resident and non-resident individuals/households/entities
Remittances 2021:
0% of GDP (2021 est.)
Remittances 2022:
0% of GDP (2022 est.)
Remittances 2023:
0% of GDP (2023 est.)
Reserves of foreign exchange and gold
$1.05 billion
Note:
<b>note:</b> holdings of gold (year-end prices)/foreign exchange/special drawing rights in current dollars
Reserves of foreign exchange and gold 2021:
$211.591 million (2021 est.)
Reserves of foreign exchange and gold 2022:
$1.013 billion (2022 est.)
Reserves of foreign exchange and gold 2023:
$1.05 billion (2023 est.)
Unemployment rate
1.06%
Note:
<b>note:</b> % of labor force seeking employment
Unemployment rate 2022:
1.1% (2022 est.)
Unemployment rate 2023:
1.1% (2023 est.)
Unemployment rate 2024:
1.1% (2024 est.)
Youth unemployment rate (ages 15-24)
Female:
0.7% (2024 est.)
Male:
2.1% (2024 est.)
Note:
<b>note:</b> % of labor force ages 15-24 seeking employment
Total:
1.5% (2024 est.)
World Bank Indicators
Currency
Congolese franc (CDF) FC (2025)
Exports (US$)
$34.60B (2024)
External Debt
$12.48B (2024)
FDI Net Inflows (US$)
$2.92B (2024)
GDP Growth (%)
6.13 (2024)
Gdp Nominal
$70.96B (2024)
GDP Per Capita
649 (2024)
Gini Index
42.10 (2012)
Govt Debt Pct Gdp
14.94 (2022)
Imports (US$)
$36.76B (2024)
Languages
French, Kikongo, Lingala, Tshiluba, Swahili (2025)
Reserves
$5.10B (2023)
Unemployment Rate (%)
4.42 (2024)
Youth Unemployment
7.95 (2024)
Economic Rankings
GDP Growth Rate
#9
Gini Index
#43
Inflation Rate
#66
External Debt
#96
GDP (Nominal)
#124
GDP (PPP)
#126
Exports
#136
Reserves
#138
Imports
#154
Unemployment Rate
#174
GDP per Capita
#179
Quick Facts
Industries
oil, cotton textiles, brewing, natron (sodium carbonate), soap, cigarettes, construction materials
Agricultural products
sorghum, groundnuts, millet, beef, cereals, yams, sugarcane, maize, cassava, milk (2023)
Labor force
6.6 million (2024 est.)
Exports - partners
UAE 26%, China 19%, Germany 17%, Netherlands 13%, France 10% (2023)
Imports - partners
China 28%, UAE 23%, Turkey 10%, France 9%, India 5% (2023)
Exchange rates
Cooperation Financiere en Afrique Centrale francs (XAF) per US dollar -
Explore More
Our Partners
Trusted partner applications powering global data and insights