Countries
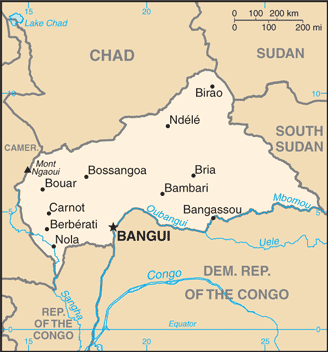
Central African Republic

Key Economic Indicators
$6.73 billion
$1,263
1.5%
1.48%
6.25%
$2.752 billion (2024 est.)
56% of GDP (2016 est.)
Economic Overview
enormous natural resources; extreme poverty; weak public institutions and infrastructure; political and gender-based violence have led to displacement of roughly 25% of population; Bangui-Douala corridor blockade reduced activity and tax collection; strong agricultural performance offset COVID-19 downturn
All Economic Data
Agricultural products
cassava, groundnuts, yams, coffee, maize, sesame seeds, taro, sugarcane, beef, milk (2023)
note:
<b>note:</b> top ten agricultural products based on tonnage
Budget
Expenditures:
$462.104 million (2021 est.)
Note:
<b>note:</b> central government revenues and expenses (excluding grants/extrabudgetary units/social security funds) converted to US dollars at average official exchange rate for year indicated
Revenues:
$360.48 million (2021 est.)
Currency
code:
XAF
name:
Central African CFA franc (XAF) [Fr]
Debt - external
$1.05 billion
Debt - external 2023:
$724.179 million (2023 est.)
Note:
<b>note:</b> present value of external debt in current US dollars
Exchange rates
Currency:
Cooperation Financiere en Afrique Centrale francs (XAF) per US dollar -
Exchange rates 2020:
575.586 (2020 est.)
Exchange rates 2021:
554.531 (2021 est.)
Exchange rates 2022:
623.76 (2022 est.)
Exchange rates 2023:
606.57 (2023 est.)
Exchange rates 2024:
606.345 (2024 est.)
Exports
$412.92 million
Exports 2022:
$293.074 million (2022 est.)
Exports 2023:
$369.034 million (2023 est.)
Exports 2024:
$425.306 million (2024 est.)
Note:
<strong>note: </strong>GDP expenditure basis - exports of goods and services in current dollars
Exports - commodities
gold, wood, diamonds, vehicle parts/accessories, cotton (2023)
note:
<b>note:</b> top five export commodities based on value in dollars
Exports - partners
UAE 54%, China 14%, France 6%, Turkey 5%, Belgium 4% (2023)
note:
<b>note:</b> top five export partners based on percentage share of exports
Foreign direct investment
net inflows:
$40.41 million
GDP - composition, by end use
Exports of goods and services:
15.5% (2024 est.)
Government consumption:
9.7% (2024 est.)
Household consumption:
94.7% (2024 est.)
Imports of goods and services:
-32.4% (2024 est.)
Investment in fixed capital:
15.4% (2024 est.)
Investment in inventories:
0% (2024 est.)
Note:
<b>note:</b> figures may not total 100% due to rounding or gaps in data collection
GDP - composition, by sector of origin
Agriculture:
32.5% (2024 est.)
Industry:
17.8% (2024 est.)
Note:
<b>note:</b> figures may not total 100% due to non-allocated consumption not captured in sector-reported data
Services:
40.5% (2024 est.)
GDP (official exchange rate)
$2.752 billion (2024 est.)
note:
<b>note:</b> data in current dollars at official exchange rate
GDP per capita (nominal)
$516
Gini Index coefficient - distribution of family income
56.2 (2008)
Gini Index coefficient - distribution of family income 2021:
43 (2021 est.)
Note:
<b>note:</b> index (0-100) of income distribution; higher values represent greater inequality
GNI (gross national income)
$2.92 billion
GNI per capita
$510
Gross domestic investment
24 % of GDP
Household income or consumption by percentage share
Highest 10%:
33.1% (2021 est.)
Lowest 10%:
2.1% (2021 est.)
Note:
<b>note:</b> % share of income accruing to lowest and highest 10% of population
Imports
$864.65 million
Imports 2022:
$784.669 million (2022 est.)
Imports 2023:
$742.108 million (2023 est.)
Imports 2024:
$890.572 million (2024 est.)
Note:
<strong>note: </strong>GDP expenditure basis - imports of goods and services in current dollars
Imports - commodities
refined petroleum, cars, packaged medicine, vaccines, tanks and armored vehicles (2023)
note:
<b>note:</b> top five import commodities based on value in dollars
Imports - partners
China 16%, Cameroon 14%, France 8%, Belgium 6%, Cote d'Ivoire 5% (2023)
note:
<b>note:</b> top five import partners based on percentage share of imports
Industrial production growth rate
9.7% (2024 est.)
note:
<b>note:</b> annual % change in industrial value added based on constant local currency
Industries
gold and diamond mining, logging, brewing, sugar refining
Inflation rate (consumer prices)
1.48%
Inflation rate (consumer prices) 2021:
4.3% (2021 est.)
Inflation rate (consumer prices) 2022:
5.6% (2022 est.)
Inflation rate (consumer prices) 2023:
3% (2023 est.)
Note:
<b>note:</b> annual % change based on consumer prices
Labor force
2 million (2024 est.)
note:
<b>note:</b> number of people ages 15 or older who are employed or seeking work
total:
2.08 million persons
Labor force - by occupation
agriculture:
66.06%
industry:
13.39%
services:
20.55%
Population below poverty line
68.8% (2021 est.)
note:
<b>note:</b> % of population with income below national poverty line
Public debt
Public debt 2016:
56% of GDP (2016 est.)
Real GDP (purchasing power parity)
$6.73 billion
Note:
<b>note:</b> data in 2021 dollars
Real GDP (purchasing power parity) 2022:
$5.795 billion (2022 est.)
Real GDP (purchasing power parity) 2023:
$5.836 billion (2023 est.)
Real GDP (purchasing power parity) 2024:
$5.926 billion (2024 est.)
Real GDP growth rate
1.5%
Note:
<b>note:</b> annual GDP % growth based on constant local currency
Real GDP growth rate 2022:
0.5% (2022 est.)
Real GDP growth rate 2023:
0.7% (2023 est.)
Real GDP growth rate 2024:
1.5% (2024 est.)
Real GDP per capita
$1,263
Note:
<b>note:</b> data in 2021 dollars
Real GDP per capita 2022:
$1,100 (2022 est.)
Real GDP per capita 2023:
$1,100 (2023 est.)
Real GDP per capita 2024:
$1,100 (2024 est.)
Remittances
Note:
<strong>note:</strong> personal transfers and compensation between resident and non-resident individuals/households/entities
Remittances 2021:
0% of GDP (2021 est.)
Remittances 2022:
0% of GDP (2022 est.)
Remittances 2023:
0% of GDP (2023 est.)
Reserves of foreign exchange and gold
$479.59 million
Note:
<b>note:</b> holdings of gold (year-end prices)/foreign exchange/special drawing rights in current dollars
Reserves of foreign exchange and gold 2021:
$483.872 million (2021 est.)
Reserves of foreign exchange and gold 2022:
$374.405 million (2022 est.)
Reserves of foreign exchange and gold 2023:
$479.593 million (2023 est.)
Revenue (excl grants)
9 % of GDP
Tax revenue
8 % of GDP
Taxes and other revenues
8.2% (of GDP) (2021 est.)
note:
<b>note:</b> central government tax revenue as a % of GDP
Unemployment rate
6.25%
Note:
<b>note:</b> % of labor force seeking employment
Unemployment rate 2022:
6% (2022 est.)
Unemployment rate 2023:
5.9% (2023 est.)
Unemployment rate 2024:
5.9% (2024 est.)
Youth unemployment rate (ages 15-24)
Female:
10.6% (2024 est.)
Male:
8.5% (2024 est.)
Note:
<b>note:</b> % of labor force ages 15-24 seeking employment
Total:
9.5% (2024 est.)
Economic Rankings
Gini Index
#6
Unemployment Rate
#78
External Debt
#110
Inflation Rate
#151
Reserves
#160
GDP (Nominal)
#168
GDP (PPP)
#171
Imports
#176
GDP Growth Rate
#178
Exports
#178
GDP per Capita
#183
Quick Facts
Industries
gold and diamond mining, logging, brewing, sugar refining
Agricultural products
cassava, groundnuts, yams, coffee, maize, sesame seeds, taro, sugarcane, beef, milk (2023)
Labor force
2 million (2024 est.)
Exports - partners
UAE 54%, China 14%, France 6%, Turkey 5%, Belgium 4% (2023)
Imports - partners
China 16%, Cameroon 14%, France 8%, Belgium 6%, Cote d'Ivoire 5% (2023)
Exchange rates
Cooperation Financiere en Afrique Centrale francs (XAF) per US dollar -
Explore More
Our Partners
Trusted partner applications powering global data and insights