Countries
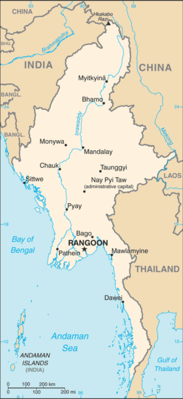
Burma

Key Economic Indicators
$326.86 billion
$5,997
-0.97%
4.6% (2017 est.)
3.05%
$74.08 billion (2024 est.)
35.7% of GDP (2016 est.)
-$4.917 billion (2017 est.)
Economic Overview
slowly recovering Southeast Asian economy; household incomes weaken domestic consumption; growing trade deficit; declining employment; high inflation and reduced currency power; agriculture sector remains most stable
All Economic Data
Agricultural products
rice, sugarcane, vegetables, beans, maize, groundnuts, plantains, fruits, coconuts, onions (2023)
note:
<b>note:</b> top ten agricultural products based on tonnage
Average household expenditures
On alcohol and tobacco:
0.5% of household expenditures (2023 est.)
On food:
53.9% of household expenditures (2023 est.)
Budget
Expenditures:
$10.22 billion (2019 est.)
Note:
<b>note:</b> central government revenues (excluding grants) and expenses converted to US dollars at average official exchange rate for year indicated
Revenues:
$10.945 billion (2019 est.)
Currency
code:
MMK
name:
Burmese kyat (MMK) [Ks]
Current account balance
Current account balance 2017:
-$4.917 billion (2017 est.)
Current account balance 2018:
-$2.561 billion (2018 est.)
Current account balance 2019:
$67.72 million (2019 est.)
Note:
<b>note:</b> balance of payments - net trade and primary/secondary income in current dollars
Debt - external
$11.17 billion
Debt - external 2023:
$8.748 billion (2023 est.)
Note:
<strong>note:</strong> present value of external debt in current US dollars
Exchange rates
Currency:
kyats (MMK) per US dollar -
Exchange rates 2019:
1,518.255 (2019 est.)
Exchange rates 2020:
1,381.619 (2020 est.)
Exchange rates 2021:
1,615.367 (2021 est.)
Exchange rates 2022:
1,932.543 (2022 est.)
Exchange rates 2023:
2,100 (2023 est.)
Exports
Exports 2018:
$15.728 billion (2018 est.)
Exports 2019:
$17.523 billion (2019 est.)
Exports 2021:
$20.4 billion (2021 est.)
Note:
<b>note:</b> balance of payments - exports of goods and services in current dollars
Exports - commodities
garments, natural gas, dried legumes, rare-earth metal compounds, precious stones (2023)
note:
<b>note:</b> top five export commodities based on value in dollars
Exports - partners
China 32%, Thailand 16%, Japan 7%, Germany 6%, India 5% (2023)
note:
<b>note:</b> top five export partners based on percentage share of exports
Foreign direct investment
net inflows:
$1.1 billion
GDP - composition, by sector of origin
Agriculture:
20.8% (2024 est.)
Industry:
37.8% (2024 est.)
Note:
<b>note:</b> figures may not total 100% due to non-allocated consumption not captured in sector-reported data
Services:
41.4% (2024 est.)
GDP (official exchange rate)
$74.08 billion (2024 est.)
note:
<b>note:</b> data in current dollars at official exchange rate
GDP per capita (nominal)
$1,359
Gini Index coefficient - distribution of family income
30.7 (2017)
Gini Index coefficient - distribution of family income 2017:
30.7 (2017 est.)
Note:
<b>note:</b> index (0-100) of income distribution; higher values represent greater inequality
GNI (gross national income)
$72.7 billion
GNI per capita
$1,210
Household income or consumption by percentage share
Highest 10%:
25.5% (2017 est.)
Lowest 10%:
3.8% (2017 est.)
Note:
<b>note:</b> % share of income accruing to lowest and highest 10% of population
Imports
Imports 2018:
$18.664 billion (2018 est.)
Imports 2019:
$17.356 billion (2019 est.)
Imports 2021:
$23.1 billion (2021 est.)
Note:
<b>note:</b> balance of payments - imports of goods and services in current dollars
Imports - commodities
refined petroleum, synthetic fabric, fertilizers, crude petroleum, fabric (2023)
note:
<b>note:</b> top five import commodities based on value in dollars
Imports - partners
China 40%, Thailand 18%, Singapore 15%, Indonesia 4%, Malaysia 4% (2023)
note:
<b>note:</b> top five import partners based on percentage share of imports
Industrial production growth rate
-0.2% (2024 est.)
note:
<b>note:</b> annual % change in industrial value added based on constant local currency
Industries
agricultural processing; wood and wood products; copper, tin, tungsten, iron; cement, construction materials; pharmaceuticals; fertilizer; oil and natural gas; garments; jade and gems
Inflation rate (consumer prices)
Inflation rate (consumer prices) 2017:
4.6% (2017 est.)
Inflation rate (consumer prices) 2018:
6.9% (2018 est.)
Inflation rate (consumer prices) 2019:
8.8% (2019 est.)
Note:
<b>note:</b> annual % change based on consumer prices
Labor force
22.742 million (2024 est.)
note:
<b>note:</b> number of people ages 15 or older who are employed or seeking work
total:
22.94 million persons
Labor force - by occupation
agriculture:
44.95%
industry:
18.16%
services:
36.89%
Population below poverty line
24.8% (2017 est.)
note:
<b>note:</b> % of population with income below national poverty line
Public debt
Public debt 2016:
35.7% of GDP (2016 est.)
Real GDP (purchasing power parity)
$326.86 billion
Note:
<b>note:</b> data in 2021 dollars
Real GDP (purchasing power parity) 2022:
$287.624 billion (2022 est.)
Real GDP (purchasing power parity) 2023:
$290.381 billion (2023 est.)
Real GDP (purchasing power parity) 2024:
$287.559 billion (2024 est.)
Real GDP growth rate
-0.97%
Note:
<b>note:</b> annual GDP % growth based on constant local currency
Real GDP growth rate 2022:
4% (2022 est.)
Real GDP growth rate 2023:
1% (2023 est.)
Real GDP growth rate 2024:
-1% (2024 est.)
Real GDP per capita
$5,997
Note:
<b>note:</b> data in 2021 dollars
Real GDP per capita 2022:
$5,400 (2022 est.)
Real GDP per capita 2023:
$5,400 (2023 est.)
Real GDP per capita 2024:
$5,300 (2024 est.)
Remittances
$1.15 billion
Note:
<b>note:</b> personal transfers and compensation between resident and non-resident individuals/households/entities
Remittances 2021:
1.9% of GDP (2021 est.)
Remittances 2022:
2% of GDP (2022 est.)
Remittances 2023:
1.6% of GDP (2023 est.)
Reserves of foreign exchange and gold
$9.34 billion
Note:
<b>note:</b> holdings of gold (year-end prices)/foreign exchange/special drawing rights in current dollars
Reserves of foreign exchange and gold 2021:
$9.103 billion (2021 est.)
Reserves of foreign exchange and gold 2022:
$8.182 billion (2022 est.)
Reserves of foreign exchange and gold 2023:
$9.338 billion (2023 est.)
Taxes and other revenues
6% (of GDP) (2019 est.)
note:
<b>note:</b> central government tax revenue as a % of GDP
Unemployment rate
3.05%
Note:
<b>note:</b> % of labor force seeking employment
Unemployment rate 2022:
3.1% (2022 est.)
Unemployment rate 2023:
3.1% (2023 est.)
Unemployment rate 2024:
3.1% (2024 est.)
Youth unemployment rate (ages 15-24)
Female:
9.4% (2024 est.)
Male:
10.5% (2024 est.)
Note:
<b>note:</b> % of labor force ages 15-24 seeking employment
Total:
10% (2024 est.)
Economic Rankings
GDP (PPP)
#62
External Debt
#68
Reserves
#82
GDP (Nominal)
#84
Exports
#90
Imports
#91
Inflation Rate
#91
GDP Growth Rate
#132
Unemployment Rate
#148
GDP per Capita
#149
Gini Index
#150
Quick Facts
Industries
agricultural processing; wood and wood products; copper, tin, tungsten, iron; cement, construction materials; pharmaceuticals; fertilizer; oil and natural gas; garments; jade and gems
Agricultural products
rice, sugarcane, vegetables, beans, maize, groundnuts, plantains, fruits, coconuts, onions (2023)
Labor force
22.742 million (2024 est.)
Exports - partners
China 32%, Thailand 16%, Japan 7%, Germany 6%, India 5% (2023)
Imports - partners
China 40%, Thailand 18%, Singapore 15%, Indonesia 4%, Malaysia 4% (2023)
Exchange rates
kyats (MMK) per US dollar -
Explore More
Our Partners
Trusted partner applications powering global data and insights