Countries
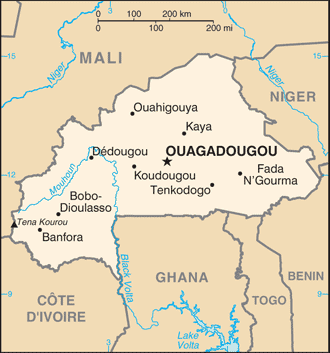
Burkina Faso
Key Economic Indicators
$68.19 billion
$2,896
4.8%
4.19%
3.48%
$23.25 billion (2024 est.)
62 % of GDP
$-1,017,189,769
Economic Overview
highly agrarian, low-income economy; limited natural resources; widespread poverty; terrorism disrupting potential economic activity; improving trade balance via increases in gold exports; economy inflating after prior deflation; growing public debt but still manageable
All Economic Data
Agricultural products
maize, sorghum, fruits, vegetables, millet, cowpeas, cotton, groundnuts, sugarcane, rice (2023)
note:
<b>note:</b> top ten agricultural products based on tonnage
Budget
Expenditures:
$6.308 billion (2023 est.)
Note:
<b>note:</b> central government revenues (excluding grants) and expenditures converted to US dollars at average official exchange rate for year indicated
Revenues:
$5.174 billion (2023 est.)
Currency
code:
XOF
name:
West African CFA franc (XOF) [Fr]
Current account balance
$-1,017,189,769
Current account balance 2021:
$77.255 million (2021 est.)
Current account balance 2022:
-$1.404 billion (2022 est.)
Current account balance 2023:
-$1.017 billion (2023 est.)
Note:
<b>note:</b> balance of payments - net trade and primary/secondary income in current dollars
Debt - external
$10.85 billion
Debt - external 2023:
$3.565 billion (2023 est.)
Note:
<b>note:</b> present value of external debt in current US dollars
Exchange rates
Currency:
Communaute Financiere Africaine francs (XOF) per US dollar -
Exchange rates 2020:
575.586 (2020 est.)
Exchange rates 2021:
554.531 (2021 est.)
Exchange rates 2022:
623.76 (2022 est.)
Exchange rates 2023:
606.57 (2023 est.)
Exchange rates 2024:
606.345 (2024 est.)
Exports
$6.6 billion
Exports 2021:
$6.234 billion (2021 est.)
Exports 2022:
$5.814 billion (2022 est.)
Exports 2023:
$5.912 billion (2023 est.)
Note:
<b>note:</b> balance of payments - exports of goods and services in current dollars
Exports - commodities
gold, cotton, oil seeds, coconuts/brazil nuts/cashews, cement (2023)
note:
<b>note:</b> top five export commodities based on value in dollars
Exports - partners
Switzerland 72%, UAE 10%, India 3%, Mali 3%, Cote d'Ivoire 2% (2023)
note:
<b>note:</b> top five export partners based on percentage share of exports
Foreign direct investment
net inflows:
$82.94 million
GDP - composition, by end use
Exports of goods and services:
28.5% (2024 est.)
Government consumption:
18.8% (2024 est.)
Household consumption:
60.6% (2024 est.)
Imports of goods and services:
-34.9% (2024 est.)
Investment in fixed capital:
16.5% (2024 est.)
Investment in inventories:
10.6% (2024 est.)
Note:
<b>note:</b> figures may not total 100% due to rounding or gaps in data collection
GDP - composition, by sector of origin
Agriculture:
18.6% (2024 est.)
Industry:
29.7% (2024 est.)
Note:
<b>note:</b> figures may not total 100% due to non-allocated consumption not captured in sector-reported data
Services:
40.2% (2024 est.)
GDP (official exchange rate)
$23.25 billion (2024 est.)
note:
<b>note:</b> data in current dollars at official exchange rate
GDP per capita (nominal)
$982
Gini Index coefficient - distribution of family income
35.3 (2014)
Gini Index coefficient - distribution of family income 2021:
37.4 (2021 est.)
Note:
<b>note:</b> index (0-100) of income distribution; higher values represent greater inequality
GNI (gross national income)
$21.74 billion
GNI per capita
$850
Gross domestic investment
22 % of GDP
Household income or consumption by percentage share
Highest 10%:
30.2% (2021 est.)
Lowest 10%:
3% (2021 est.)
Note:
<b>note:</b> % share of income accruing to lowest and highest 10% of population
Imports
$7.39 billion
Imports 2021:
$5.835 billion (2021 est.)
Imports 2022:
$6.761 billion (2022 est.)
Imports 2023:
$6.834 billion (2023 est.)
Note:
<b>note:</b> balance of payments - imports of goods and services in current dollars
Imports - commodities
refined petroleum, plastic products, cement, electricity, packaged medicine (2023)
note:
<b>note:</b> top five import commodities based on value in dollars
Imports - partners
Cote d'Ivoire 14%, China 13%, Ghana 9%, Russia 9%, France 7% (2023)
note:
<b>note:</b> top five import partners based on percentage share of imports
Industrial production growth rate
-5.4% (2024 est.)
note:
<b>note:</b> annual % change in industrial value added based on constant local currency
Industries
cotton lint, beverages, agricultural processing, soap, cigarettes, textiles, gold
Inflation rate (consumer prices)
4.19%
Inflation rate (consumer prices) 2022:
14.3% (2022 est.)
Inflation rate (consumer prices) 2023:
0.7% (2023 est.)
Inflation rate (consumer prices) 2024:
4.2% (2024 est.)
Note:
<b>note:</b> annual % change based on consumer prices
Labor force
6.461 million (2024 est.)
note:
<b>note:</b> number of people ages 15 or older who are employed or seeking work
total:
9.91 million persons
Labor force - by occupation
agriculture:
51.78%
industry:
16.67%
services:
31.56%
Population below poverty line
43.2% (2021 est.)
note:
<b>note:</b> % of population with income below national poverty line
Public debt
62 % of GDP
Note:
<b>note:</b> central government debt as a % of GDP
Public debt 2023:
61.3% of GDP (2023 est.)
Real GDP (purchasing power parity)
$68.19 billion
Note:
<b>note:</b> data in 2021 dollars
Real GDP (purchasing power parity) 2022:
$55.508 billion (2022 est.)
Real GDP (purchasing power parity) 2023:
$57.152 billion (2023 est.)
Real GDP (purchasing power parity) 2024:
$60.001 billion (2024 est.)
Real GDP growth rate
4.8%
Note:
<b>note:</b> annual GDP % growth based on constant local currency
Real GDP growth rate 2022:
1.5% (2022 est.)
Real GDP growth rate 2023:
3% (2023 est.)
Real GDP growth rate 2024:
5% (2024 est.)
Real GDP per capita
$2,896
Note:
<b>note:</b> data in 2021 dollars
Real GDP per capita 2022:
$2,500 (2022 est.)
Real GDP per capita 2023:
$2,500 (2023 est.)
Real GDP per capita 2024:
$2,500 (2024 est.)
Remittances
$590 million
Note:
<b>note:</b> personal transfers and compensation between resident and non-resident individuals/households/entities
Remittances 2021:
2.9% of GDP (2021 est.)
Remittances 2022:
2.8% of GDP (2022 est.)
Remittances 2023:
2.9% of GDP (2023 est.)
Revenue (excl grants)
21 % of GDP
Tax revenue
19 % of GDP
Taxes and other revenues
18.4% (of GDP) (2023 est.)
note:
<b>note:</b> central government tax revenue as a % of GDP
Unemployment rate
3.48%
Note:
<b>note:</b> % of labor force seeking employment
Unemployment rate 2022:
5.4% (2022 est.)
Unemployment rate 2023:
5.4% (2023 est.)
Unemployment rate 2024:
5.2% (2024 est.)
Youth unemployment rate (ages 15-24)
Female:
8.5% (2024 est.)
Male:
7.8% (2024 est.)
Note:
<b>note:</b> % of labor force ages 15-24 seeking employment
Total:
8.1% (2024 est.)
World Bank Indicators
Broad Money
42.31 (2024)
Current Account Balance (US$)
-1,017,189,768.88 (2023)
Exchange Rate
606 (2024)
Exports (US$)
$6.60B (2024)
External Debt
$10.85B (2024)
FDI Net Inflows (US$)
0.36 (2024)
GDP Growth (%)
4.80 (2024)
GDP Per Capita
982 (2024)
GDP (Current US$)
$23.12B (2024)
Gini Index
37.40 (2021)
Government Debt (% GDP)
61.93 (2023)
Govt Expenditure
19.57 (2023)
Govt Revenue
21.41 (2023)
Imports (US$)
$7.39B (2024)
Inflation Rate (%)
4.19 (2024)
Population
$23.55M (2024)
Trade Pct Gdp
60.50 (2024)
Unemployment Rate (%)
3.48 (2025)
Youth Unemployment
6.44 (2025)
Economic Rankings
Inflation Rate
#44
External Debt
#69
Gini Index
#86
Unemployment Rate
#94
GDP Growth Rate
#100
GDP (PPP)
#114
GDP (Nominal)
#120
Exports
#131
Imports
#136
GDP per Capita
#178
Quick Facts
Industries
cotton lint, beverages, agricultural processing, soap, cigarettes, textiles, gold
Agricultural products
maize, sorghum, fruits, vegetables, millet, cowpeas, cotton, groundnuts, sugarcane, rice (2023)
Labor force
6.461 million (2024 est.)
Exports - partners
Switzerland 72%, UAE 10%, India 3%, Mali 3%, Cote d'Ivoire 2% (2023)
Imports - partners
Cote d'Ivoire 14%, China 13%, Ghana 9%, Russia 9%, France 7% (2023)
Exchange rates
Communaute Financiere Africaine francs (XOF) per US dollar -
Explore More
Our Partners
Trusted partner applications powering global data and insights