Countries
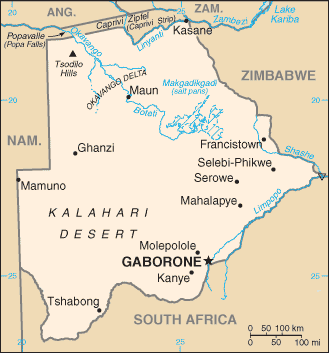
Botswana

Key Economic Indicators
$51.78 billion
$20,538
-2.99%
2.82%
24.48%
$19.401 billion (2024 est.)
<b>note:</b> central government debt as a % of GDP
$-821,137,482
Economic Overview
good economic governance and financial management; diamond-driven growth model declining; rapid poverty reductions; high unemployment, particularly among youth; COVID-19 sharply contracted the economy and recovery is slow; public sector wages have posed fiscal challenges
All Economic Data
Agricultural products
root vegetables, beef, vegetables, sorghum, maize, game meat, milk, watermelons, goat milk, sunflower seeds (2023)
note:
<b>note:</b> top ten agricultural products based on tonnage
Budget
Expenditures:
$6.296 billion (2024 est.)
Note:
<b>note:</b> central government revenues and expenses (excluding grants/extrabudgetary units/social security funds) converted to US dollars at average official exchange rate for year indicated
Revenues:
$5.474 billion (2024 est.)
Currency
code:
BWP
name:
Botswana pula (BWP) [P]
Current account balance
$-821,137,482
Current account balance 2021:
-$314.583 million (2021 est.)
Current account balance 2022:
-$232.122 million (2022 est.)
Current account balance 2023:
-$116.727 million (2023 est.)
Note:
<b>note:</b> balance of payments - net trade and primary/secondary income in current dollars
Debt - external
$2.32 billion
Debt - external 2023:
$1.761 billion (2023 est.)
Note:
<b>note:</b> present value of external debt in current US dollars
Exchange rates
Currency:
pulas (BWP) per US dollar -
Exchange rates 2020:
11.456 (2020 est.)
Exchange rates 2021:
11.087 (2021 est.)
Exchange rates 2022:
12.369 (2022 est.)
Exchange rates 2023:
13.596 (2023 est.)
Exchange rates 2024:
13.563 (2024 est.)
Exports
$5.32 billion
Exports 2021:
$7.861 billion (2021 est.)
Exports 2022:
$8.914 billion (2022 est.)
Exports 2023:
$6.398 billion (2023 est.)
Note:
<b>note:</b> balance of payments - exports of goods and services in current dollars
Exports - commodities
diamonds, copper ore, insulated wire, carbonates, cattle (2023)
note:
<b>note:</b> top five export commodities based on value in dollars
Exports - partners
UAE 27%, India 17%, Belgium 16%, South Africa 8%, USA 7% (2023)
note:
<b>note:</b> top five export partners based on percentage share of exports
Foreign direct investment
net inflows:
$467.27 million
GDP - composition, by end use
Exports of goods and services:
26% (2024 est.)
Government consumption:
32.1% (2024 est.)
Household consumption:
45.3% (2024 est.)
Imports of goods and services:
-40.9% (2024 est.)
Investment in fixed capital:
28.5% (2024 est.)
Investment in inventories:
7.7% (2024 est.)
Note:
<b>note:</b> figures may not total 100% due to rounding or gaps in data collection
GDP - composition, by sector of origin
Agriculture:
1.7% (2024 est.)
Industry:
29.4% (2024 est.)
Note:
<b>note:</b> figures may not total 100% due to non-allocated consumption not captured in sector-reported data
Services:
63.5% (2024 est.)
GDP (official exchange rate)
$19.401 billion (2024 est.)
note:
<b>note:</b> data in current dollars at official exchange rate
GDP per capita (nominal)
$7,696
Gini Index coefficient - distribution of family income
53.3 (2015)
Gini Index coefficient - distribution of family income 2015:
54.9 (2015 est.)
Note:
<b>note:</b> index (0-100) of income distribution; higher values represent greater inequality
GNI (gross national income)
$19.43 billion
GNI per capita
$7,750
Gross domestic investment
36 % of GDP
Household income or consumption by percentage share
Highest 10%:
42.9% (2015 est.)
Lowest 10%:
1.4% (2015 est.)
Note:
<b>note:</b> % share of income accruing to lowest and highest 10% of population
Imports
$8.48 billion
Imports 2021:
$9.25 billion (2021 est.)
Imports 2022:
$8.826 billion (2022 est.)
Imports 2023:
$7.228 billion (2023 est.)
Note:
<b>note:</b> balance of payments - imports of goods and services in current dollars
Imports - commodities
refined petroleum, diamonds, cars, flavored water, electricity (2023)
note:
<b>note:</b> top five import commodities based on value in dollars
Imports - partners
South Africa 65%, Namibia 8%, Canada 5%, China 3%, India 3% (2023)
note:
<b>note:</b> top five import partners based on percentage share of imports
Industrial production growth rate
-13.5% (2024 est.)
note:
<b>note:</b> annual % change in industrial value added based on constant local currency
Industries
diamonds, copper, nickel, salt, soda ash, potash, coal, iron ore, silver; beef processing; textiles
Inflation rate (consumer prices)
2.82%
Inflation rate (consumer prices) 2022:
11.7% (2022 est.)
Inflation rate (consumer prices) 2023:
5.1% (2023 est.)
Inflation rate (consumer prices) 2024:
2.8% (2024 est.)
Note:
<b>note:</b> annual % change based on consumer prices
Labor force
1.173 million (2024 est.)
note:
<b>note:</b> number of people ages 15 or older who are employed or seeking work
total:
1.2 million persons
Labor force - by occupation
agriculture:
18.03%
industry:
15.77%
services:
66.2%
Population below poverty line
16.1% (2015 est.)
note:
<b>note:</b> % of population with income below national poverty line
Public debt
Note:
<b>note:</b> central government debt as a % of GDP
Public debt 2020:
19.6% of GDP (2020 est.)
Real GDP (purchasing power parity)
$51.78 billion
Note:
<b>note:</b> data in 2021 dollars
Real GDP (purchasing power parity) 2022:
$45.498 billion (2022 est.)
Real GDP (purchasing power parity) 2023:
$46.957 billion (2023 est.)
Real GDP (purchasing power parity) 2024:
$45.553 billion (2024 est.)
Real GDP growth rate
-2.99%
Note:
<b>note:</b> annual GDP % growth based on constant local currency
Real GDP growth rate 2022:
5.5% (2022 est.)
Real GDP growth rate 2023:
3.2% (2023 est.)
Real GDP growth rate 2024:
-3% (2024 est.)
Real GDP per capita
$20,538
Note:
<b>note:</b> data in 2021 dollars
Real GDP per capita 2022:
$18,600 (2022 est.)
Real GDP per capita 2023:
$18,900 (2023 est.)
Real GDP per capita 2024:
$18,100 (2024 est.)
Remittances
$128.3 million
Note:
<b>note:</b> personal transfers and compensation between resident and non-resident individuals/households/entities
Remittances 2021:
0.3% of GDP (2021 est.)
Remittances 2022:
0.3% of GDP (2022 est.)
Remittances 2023:
0.4% of GDP (2023 est.)
Reserves of foreign exchange and gold
$3.46 billion
Note:
<b>note:</b> holdings of gold (year-end prices)/foreign exchange/special drawing rights in current dollars
Reserves of foreign exchange and gold 2022:
$4.279 billion (2022 est.)
Reserves of foreign exchange and gold 2023:
$4.756 billion (2023 est.)
Reserves of foreign exchange and gold 2024:
$3.456 billion (2024 est.)
Revenue (excl grants)
28 % of GDP
Tax revenue
22 % of GDP
Taxes and other revenues
19.6% (of GDP) (2022 est.)
note:
<b>note:</b> central government tax revenue as a % of GDP
Unemployment rate
24.48%
Note:
<b>note:</b> % of labor force seeking employment
Unemployment rate 2022:
23.7% (2022 est.)
Unemployment rate 2023:
23.4% (2023 est.)
Unemployment rate 2024:
23.2% (2024 est.)
Youth unemployment rate (ages 15-24)
Female:
48.6% (2024 est.)
Male:
39.8% (2024 est.)
Note:
<b>note:</b> % of labor force ages 15-24 seeking employment
Total:
43.9% (2024 est.)
World Bank Indicators
Broad Money
43.84 (2024)
Current Account Balance (US$)
-821,137,481.64 (2024)
Exchange Rate
13.56 (2024)
Exports (US$)
$5.32B (2024)
External Debt
$2.32B (2024)
FDI Net Inflows (US$)
2.41 (2024)
GDP Growth (%)
-2.99 (2024)
GDP Per Capita
7,696 (2024)
GDP (Current US$)
$19.40B (2024)
Gini Index
54.90 (2015)
Government Debt (% GDP)
19.62 (2020)
Govt Expenditure
26.37 (2024)
Govt Revenue
28.17 (2024)
Imports (US$)
$8.48B (2024)
Inflation Rate (%)
2.82 (2024)
Population
$2.52M (2024)
Reserves
$3.46B (2024)
Trade Pct Gdp
71.11 (2024)
Unemployment Rate (%)
24.48 (2025)
Youth Unemployment
46.00 (2025)
Economic Rankings
Unemployment Rate
#4
Gini Index
#7
Inflation Rate
#56
GDP Growth Rate
#75
GDP per Capita
#91
External Debt
#101
Reserves
#106
Exports
#120
Imports
#126
GDP (PPP)
#130
GDP (Nominal)
#130
Quick Facts
Industries
diamonds, copper, nickel, salt, soda ash, potash, coal, iron ore, silver; beef processing; textiles
Agricultural products
root vegetables, beef, vegetables, sorghum, maize, game meat, milk, watermelons, goat milk, sunflower seeds (2023)
Labor force
1.173 million (2024 est.)
Exports - partners
UAE 27%, India 17%, Belgium 16%, South Africa 8%, USA 7% (2023)
Imports - partners
South Africa 65%, Namibia 8%, Canada 5%, China 3%, India 3% (2023)
Exchange rates
pulas (BWP) per US dollar -
Explore More
Our Partners
Trusted partner applications powering global data and insights