Countries
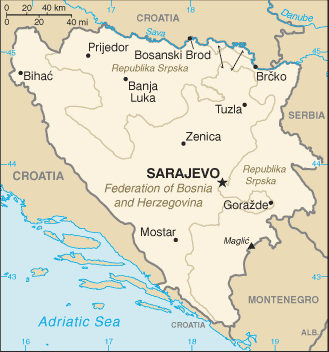
Bosnia and Herzegovina

Key Economic Indicators
$79.24 billion
$25,043
2.97%
1.69%
11.04%
$28.343 billion (2024 est.)
40 % of GDP
$-1,027,731,964
Economic Overview
import-dominated economy; remains consumption-heavy; lack of private sector investments and diversification; jointly addressing structural economic challenges; Chinese energy infrastructure investments; high unemployment; tourism industry impacted by COVID-19
All Economic Data
Agricultural products
maize, milk, vegetables, potatoes, plums, wheat, apples, barley, chicken, tomatoes (2023)
note:
<b>note:</b> top ten agricultural products based on tonnage
Average household expenditures
On alcohol and tobacco:
7.1% of household expenditures (2023 est.)
On food:
32.1% of household expenditures (2023 est.)
Budget
Expenditures:
$10.463 billion (2023 est.)
Note:
<b>note:</b> central government revenues (excluding grants) and expenditures converted to US dollars at average official exchange rate for year indicated
Revenues:
$10.196 billion (2023 est.)
Currency
code:
BAM
name:
Bosnia and Herzegovina convertible mark (BAM) [KM]
Current account balance
$-1,027,731,964
Current account balance 2022:
-$1.078 billion (2022 est.)
Current account balance 2023:
-$638.769 million (2023 est.)
Current account balance 2024:
-$1.176 billion (2024 est.)
Note:
<b>note:</b> balance of payments - net trade and primary/secondary income in current dollars
Debt - external
$13.89 billion
Debt - external 2023:
$5.359 billion (2023 est.)
Note:
<b>note:</b> present value of external debt in current US dollars
Exchange rates
Currency:
konvertibilna markas (BAM) per US dollar -
Exchange rates 2020:
1.717 (2020 est.)
Exchange rates 2021:
1.654 (2021 est.)
Exchange rates 2022:
1.859 (2022 est.)
Exchange rates 2023:
1.809 (2023 est.)
Exchange rates 2024:
1.808 (2024 est.)
Exports
$12.1 billion
Exports 2022:
$11.838 billion (2022 est.)
Exports 2023:
$12.126 billion (2023 est.)
Exports 2024:
$12.141 billion (2024 est.)
Note:
<b>note:</b> balance of payments - exports of goods and services in current dollars
Exports - commodities
footwear, electricity, garments, plastic products, insulated wire (2023)
note:
<b>note:</b> top five export commodities based on value in dollars
Exports - partners
Germany 15%, Croatia 14%, Serbia 12%, Austria 10%, Slovenia 9% (2023)
note:
<b>note:</b> top five export partners based on percentage share of exports
Foreign direct investment
net inflows:
$1 billion
GDP - composition, by end use
Exports of goods and services:
43.9% (2023 est.)
Government consumption:
19.1% (2023 est.)
Household consumption:
68.3% (2023 est.)
Imports of goods and services:
-55.7% (2023 est.)
Investment in fixed capital:
23.1% (2023 est.)
Investment in inventories:
3.2% (2023 est.)
Note:
<b>note:</b> figures may not total 100% due to rounding or gaps in data collection
GDP - composition, by sector of origin
Agriculture:
4.3% (2024 est.)
Industry:
22% (2024 est.)
Note:
<b>note:</b> figures may not total 100% due to non-allocated consumption not captured in sector-reported data
Services:
58% (2024 est.)
GDP (official exchange rate)
$28.343 billion (2024 est.)
note:
<b>note:</b> data in current dollars at official exchange rate
GDP per capita (nominal)
$9,359
Gini Index coefficient - distribution of family income
33 (2011)
GNI (gross national income)
$29.55 billion
GNI per capita
$8,790
Gross domestic investment
27 % of GDP
Imports
$16.08 billion
Imports 2022:
$15.166 billion (2022 est.)
Imports 2023:
$15.37 billion (2023 est.)
Imports 2024:
$16.202 billion (2024 est.)
Note:
<b>note:</b> balance of payments - imports of goods and services in current dollars
Imports - commodities
refined petroleum, cars, garments, plastic products, packaged medicine (2023)
note:
<b>note:</b> top five import commodities based on value in dollars
Imports - partners
Italy 13%, Germany 11%, Serbia 11%, China 9%, Croatia 8% (2023)
note:
<b>note:</b> top five import partners based on percentage share of imports
Industrial production growth rate
-2.4% (2024 est.)
note:
<b>note:</b> annual % change in industrial value added based on constant local currency
Industries
steel, coal, iron ore, lead, zinc, manganese, bauxite, aluminum, motor vehicle assembly, textiles, tobacco products, wooden furniture, ammunition, domestic appliances, oil refining
Inflation rate (consumer prices)
1.69%
Inflation rate (consumer prices) 2022:
14% (2022 est.)
Inflation rate (consumer prices) 2023:
6.1% (2023 est.)
Inflation rate (consumer prices) 2024:
1.7% (2024 est.)
Note:
<strong>note:</strong> annual % change based on consumer prices
Labor force
1.356 million (2024 est.)
note:
<b>note:</b> number of people ages 15 or older who are employed or seeking work
total:
1.34 million persons
Labor force - by occupation
agriculture:
16.71%
industry:
30.6%
services:
52.69%
Population below poverty line
16.9% (2015 est.)
note:
<b>note:</b> % of population with income below national poverty line
Public debt
40 % of GDP
Note:
<b>note:</b> central government debt as a % of GDP
Public debt 2023:
40.3% of GDP (2023 est.)
Real GDP (purchasing power parity)
$79.24 billion
Note:
<b>note:</b> data in 2021 dollars
Real GDP (purchasing power parity) 2022:
$61.843 billion (2022 est.)
Real GDP (purchasing power parity) 2023:
$63.077 billion (2023 est.)
Real GDP (purchasing power parity) 2024:
$64.641 billion (2024 est.)
Real GDP growth rate
2.97%
Note:
<b>note:</b> annual GDP % growth based on constant local currency
Real GDP growth rate 2022:
4.2% (2022 est.)
Real GDP growth rate 2023:
2% (2023 est.)
Real GDP growth rate 2024:
2.5% (2024 est.)
Real GDP per capita
$25,043
Note:
<b>note:</b> data in 2021 dollars
Real GDP per capita 2022:
$19,300 (2022 est.)
Real GDP per capita 2023:
$19,800 (2023 est.)
Real GDP per capita 2024:
$20,400 (2024 est.)
Remittances
$3.12 billion
Note:
<b>note:</b> personal transfers and compensation between resident and non-resident individuals/households/entities
Remittances 2022:
10.5% of GDP (2022 est.)
Remittances 2023:
10.2% of GDP (2023 est.)
Remittances 2024:
11% of GDP (2024 est.)
Reserves of foreign exchange and gold
$9.42 billion
Note:
<b>note:</b> holdings of gold (year-end prices)/foreign exchange/special drawing rights in current dollars
Reserves of foreign exchange and gold 2022:
$8.762 billion (2022 est.)
Reserves of foreign exchange and gold 2023:
$9.205 billion (2023 est.)
Reserves of foreign exchange and gold 2024:
$9.419 billion (2024 est.)
Revenue (excl grants)
38 % of GDP
Tax revenue
20 % of GDP
Taxes and other revenues
19.1% (of GDP) (2023 est.)
note:
<b>note:</b> central government tax revenue as a % of GDP
Unemployment rate
11.04%
Note:
<b>note:</b> % of labor force seeking employment
Unemployment rate 2022:
12.7% (2022 est.)
Unemployment rate 2023:
10.7% (2023 est.)
Unemployment rate 2024:
10.8% (2024 est.)
Youth unemployment rate (ages 15-24)
Female:
30.9% (2024 est.)
Male:
25.4% (2024 est.)
Note:
<b>note:</b> % of labor force ages 15-24 seeking employment
Total:
27.3% (2024 est.)
Economic Rankings
Unemployment Rate
#29
Inflation Rate
#46
External Debt
#61
GDP per Capita
#79
Reserves
#80
Imports
#103
GDP (PPP)
#109
GDP (Nominal)
#109
Exports
#110
GDP Growth Rate
#124
Gini Index
#132
Quick Facts
Industries
steel, coal, iron ore, lead, zinc, manganese, bauxite, aluminum, motor vehicle assembly, textiles, tobacco products, wooden furniture, ammunition, domestic appliances, oil refining
Agricultural products
maize, milk, vegetables, potatoes, plums, wheat, apples, barley, chicken, tomatoes (2023)
Labor force
1.356 million (2024 est.)
Exports - partners
Germany 15%, Croatia 14%, Serbia 12%, Austria 10%, Slovenia 9% (2023)
Imports - partners
Italy 13%, Germany 11%, Serbia 11%, China 9%, Croatia 8% (2023)
Exchange rates
konvertibilna markas (BAM) per US dollar -
Explore More
Our Partners
Trusted partner applications powering global data and insights