Countries
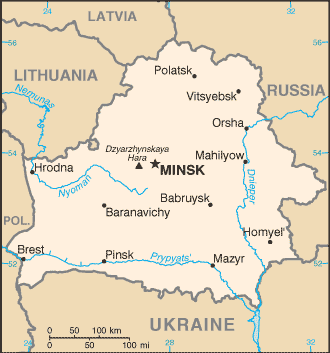
Belarus

Key Economic Indicators
$301.47 billion
$33,010
4.01%
5.79%
3.38%
$75.962 billion (2024 est.)
<b>note:</b> central government debt as a % of GDP
$-1,944,575,193
Economic Overview
declining Russian energy subsidies will end in 2024; growing public debt; strong currency pressures have led to higher inflation; recent price controls on basic food and drugs; public sector wage increases and fragile private sector threaten household income gains and economic growth
All Economic Data
Agricultural products
milk, sugar beets, potatoes, wheat, triticale, barley, maize, rapeseed, rye, chicken (2023)
note:
<b>note:</b> top ten agricultural products based on tonnage
Average household expenditures
On alcohol and tobacco:
7.6% of household expenditures (2023 est.)
On food:
29.5% of household expenditures (2023 est.)
Budget
Expenditures:
$21.912 billion (2023 est.)
Note:
<b>note:</b> central government revenues (excluding grants) and expenditures converted to US dollars at average official exchange rate for year indicated
Revenues:
$22.876 billion (2023 est.)
Currency
code:
BYN
name:
Belarusian ruble (BYN) [Br]
Current account balance
$-1,944,575,193
Current account balance 2022:
$2.628 billion (2022 est.)
Current account balance 2023:
-$1.104 billion (2023 est.)
Current account balance 2024:
-$1.925 billion (2024 est.)
Note:
<b>note:</b> balance of payments - net trade and primary/secondary income in current dollars
Debt - external
$34.22 billion
Debt - external 2023:
$18.01 billion (2023 est.)
Note:
<strong>note:</strong> present value of external debt in current US dollars
Exchange rates
Currency:
Belarusian rubles (BYB/BYR) per US dollar -
Exchange rates 2020:
2.44 (2020 est.)
Exchange rates 2021:
2.539 (2021 est.)
Exchange rates 2022:
2.626 (2022 est.)
Exchange rates 2023:
3.007 (2023 est.)
Exchange rates 2024:
3.246 (2024 est.)
Exports
$49.42 billion
Exports 2022:
$47.124 billion (2022 est.)
Exports 2023:
$47.714 billion (2023 est.)
Exports 2024:
$49.386 billion (2024 est.)
Note:
<b>note:</b> balance of payments - exports of goods and services in current dollars
Exports - commodities
fertilizers, rapeseed oil, wood, poultry, beef (2023)
note:
<b>note:</b> top five export commodities based on value in dollars
Exports - partners
China 34%, Kazakhstan 10%, Uzbekistan 7%, Poland 6%, Brazil 5% (2023)
note:
<b>note:</b> top five export partners based on percentage share of exports
Foreign direct investment
net inflows:
$1.74 billion
GDP - composition, by end use
Exports of goods and services:
65.1% (2024 est.)
Government consumption:
19% (2024 est.)
Household consumption:
56.8% (2024 est.)
Imports of goods and services:
-66.9% (2024 est.)
Investment in fixed capital:
23.8% (2024 est.)
Investment in inventories:
2% (2024 est.)
Note:
<b>note:</b> figures may not total 100% due to rounding or gaps in data collection
GDP - composition, by sector of origin
Agriculture:
6.9% (2024 est.)
Industry:
30.7% (2024 est.)
Note:
<b>note:</b> figures may not total 100% due to non-allocated consumption not captured in sector-reported data
Services:
49.7% (2024 est.)
GDP (official exchange rate)
$75.962 billion (2024 est.)
note:
<b>note:</b> data in current dollars at official exchange rate
GDP per capita (nominal)
$8,318
Gini Index coefficient - distribution of family income
25.3 (2019)
Gini Index coefficient - distribution of family income 2020:
24.4 (2020 est.)
Note:
<b>note:</b> index (0-100) of income distribution; higher values represent greater inequality
GNI (gross national income)
$74.32 billion
GNI per capita
$8,260
Gross domestic investment
26 % of GDP
Household income or consumption by percentage share
Highest 10%:
20.7% (2020 est.)
Lowest 10%:
4.5% (2020 est.)
Note:
<b>note:</b> % share of income accruing to lowest and highest 10% of population
Imports
$50.78 billion
Imports 2022:
$42.438 billion (2022 est.)
Imports 2023:
$47.459 billion (2023 est.)
Imports 2024:
$50.679 billion (2024 est.)
Note:
<b>note:</b> balance of payments - imports of goods and services in current dollars
Imports - commodities
cars, broadcasting equipment, fabric, plastic products, video displays (2023)
note:
<b>note:</b> top five import commodities based on value in dollars
Imports - partners
China 33%, Poland 16%, Germany 11%, Lithuania 10%, Turkey 9% (2023)
note:
<b>note:</b> top five import partners based on percentage share of imports
Industrial production growth rate
6% (2024 est.)
note:
<b>note:</b> annual % change in industrial value added based on constant local currency
Industries
metal-cutting machine tools, tractors, trucks, earthmovers, motorcycles, synthetic fibers, fertilizer, textiles, refrigerators, washing machines and other household appliances
Inflation rate (consumer prices)
5.79%
Inflation rate (consumer prices) 2022:
15.2% (2022 est.)
Inflation rate (consumer prices) 2023:
5% (2023 est.)
Inflation rate (consumer prices) 2024:
5.8% (2024 est.)
Note:
<b>note:</b> annual % change based on consumer prices
Labor force
4.817 million (2024 est.)
note:
<b>note:</b> number of people ages 15 or older who are employed or seeking work
total:
4.79 million persons
Labor force - by occupation
agriculture:
9.48%
industry:
31.06%
services:
59.46%
Population below poverty line
3.9% (2022 est.)
note:
<b>note:</b> % of population with income below national poverty line
Public debt
Note:
<b>note:</b> central government debt as a % of GDP
Public debt 2019:
33.2% of GDP (2019 est.)
Real GDP (purchasing power parity)
$301.47 billion
Note:
<b>note:</b> data in 2021 dollars
Real GDP (purchasing power parity) 2022:
$244.89 billion (2022 est.)
Real GDP (purchasing power parity) 2023:
$254.995 billion (2023 est.)
Real GDP (purchasing power parity) 2024:
$265.22 billion (2024 est.)
Real GDP growth rate
4.01%
Note:
<b>note:</b> annual GDP % growth based on constant local currency
Real GDP growth rate 2022:
-4.7% (2022 est.)
Real GDP growth rate 2023:
4.1% (2023 est.)
Real GDP growth rate 2024:
4% (2024 est.)
Real GDP per capita
$33,010
Note:
<b>note:</b> data in 2021 dollars
Real GDP per capita 2022:
$26,500 (2022 est.)
Real GDP per capita 2023:
$27,800 (2023 est.)
Real GDP per capita 2024:
$29,000 (2024 est.)
Remittances
$1.38 billion
Note:
<b>note:</b> personal transfers and compensation between resident and non-resident individuals/households/entities
Remittances 2022:
2% of GDP (2022 est.)
Remittances 2023:
1.7% of GDP (2023 est.)
Remittances 2024:
1.8% of GDP (2024 est.)
Reserves of foreign exchange and gold
$8.91 billion
Note:
<b>note:</b> holdings of gold (year-end prices)/foreign exchange/special drawing rights in current dollars
Reserves of foreign exchange and gold 2022:
$7.923 billion (2022 est.)
Reserves of foreign exchange and gold 2023:
$8.118 billion (2023 est.)
Reserves of foreign exchange and gold 2024:
$8.912 billion (2024 est.)
Revenue (excl grants)
28 % of GDP
Tax revenue
13 % of GDP
Taxes and other revenues
12.7% (of GDP) (2023 est.)
note:
<b>note:</b> central government tax revenue as a % of GDP
Unemployment rate
3.38%
Note:
<b>note:</b> % of labor force seeking employment
Unemployment rate 2022:
3.6% (2022 est.)
Unemployment rate 2023:
3.5% (2023 est.)
Unemployment rate 2024:
3.4% (2024 est.)
Youth unemployment rate (ages 15-24)
Female:
8.4% (2024 est.)
Male:
11.7% (2024 est.)
Note:
<b>note:</b> % of labor force ages 15-24 seeking employment
Total:
10.1% (2024 est.)
World Bank Indicators
Currency
Bolivian boliviano (BOB) Bs. (2025)
Exports (US$)
$11.76B (2024)
External Debt
$15.72B (2024)
FDI Net Inflows (US$)
$387.03M (2024)
GDP Growth (%)
-1.12 (2024)
Gdp Nominal
$54.88B (2024)
GDP Per Capita
4,421 (2024)
Gini Index
41.60 (2019)
Imports (US$)
$14.02B (2024)
Inflation Rate (%)
5.10 (2024)
Languages
Aymara, Guarani, Quechua, Spanish (2025)
Reserves
$1.98B (2024)
Unemployment Rate (%)
3.27 (2024)
Youth Unemployment
5.17 (2024)
Economic Rankings
Inflation Rate
#38
External Debt
#40
GDP (PPP)
#64
GDP per Capita
#65
Exports
#66
Imports
#67
GDP (Nominal)
#82
Reserves
#83
GDP Growth Rate
#130
Unemployment Rate
#136
Gini Index
#171
Quick Facts
Industries
metal-cutting machine tools, tractors, trucks, earthmovers, motorcycles, synthetic fibers, fertilizer, textiles, refrigerators, washing machines and other household appliances
Agricultural products
milk, sugar beets, potatoes, wheat, triticale, barley, maize, rapeseed, rye, chicken (2023)
Labor force
4.817 million (2024 est.)
Exports - partners
China 34%, Kazakhstan 10%, Uzbekistan 7%, Poland 6%, Brazil 5% (2023)
Imports - partners
China 33%, Poland 16%, Germany 11%, Lithuania 10%, Turkey 9% (2023)
Exchange rates
Belarusian rubles (BYB/BYR) per US dollar -
Explore More
Our Partners
Trusted partner applications powering global data and insights